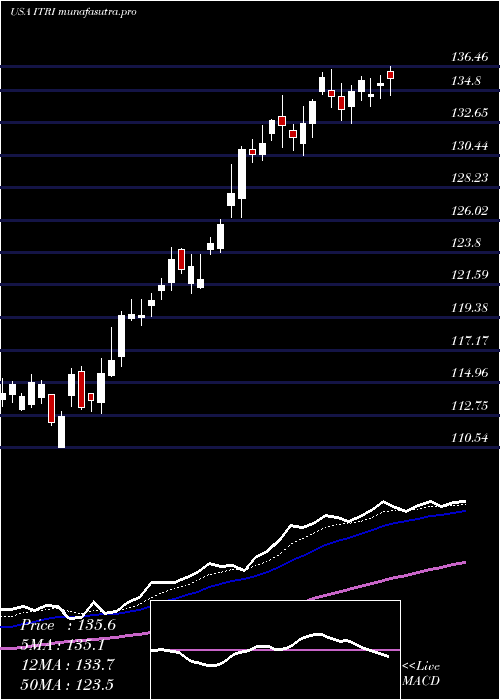
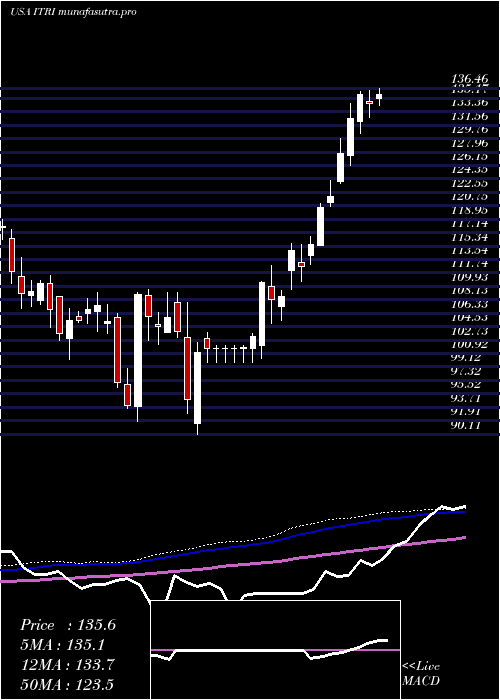
ItronInc ITRI full analysis,charts,indicators,moving averages,SMA,DMA,EMA,ADX,MACD,RSIItron Inc ITRI WideScreen charts, DMA,SMA,EMA technical analysis, forecast prediction, by indicators ADX,MACD,RSI,CCI USA stock exchange
operates under Capital Goods sector & deals in Electrical Products
Daily price and charts and targets ItronInc Strong Daily Stock price targets for ItronInc ITRI are 98.33 and 100.72 | Daily Target 1 | 96.46 | | Daily Target 2 | 97.81 | | Daily Target 3 | 98.85 | | Daily Target 4 | 100.2 | | Daily Target 5 | 101.24 |
Daily price and volume Itron Inc
| Date |
Closing |
Open |
Range |
Volume |
Thu 04 December 2025 |
99.16 (0.83%) |
98.34 |
97.50 - 99.89 |
0.8179 times |
Wed 03 December 2025 |
98.34 (1.75%) |
96.76 |
96.35 - 98.44 |
0.6092 times |
Tue 02 December 2025 |
96.65 (-0.72%) |
98.21 |
96.46 - 98.21 |
0.5605 times |
Mon 01 December 2025 |
97.35 (-1.71%) |
98.36 |
97.09 - 98.96 |
0.9089 times |
Fri 28 November 2025 |
99.04 (0.49%) |
99.01 |
98.40 - 99.35 |
0.6015 times |
Wed 26 November 2025 |
98.56 (1.63%) |
97.19 |
96.82 - 99.27 |
0.9126 times |
Tue 25 November 2025 |
96.98 (0.22%) |
97.51 |
96.82 - 99.07 |
1.5998 times |
Mon 24 November 2025 |
96.77 (1.13%) |
95.83 |
95.75 - 98.84 |
1.0234 times |
Fri 21 November 2025 |
95.69 (1.57%) |
93.95 |
93.41 - 97.19 |
1.2497 times |
Thu 20 November 2025 |
94.21 (-0.98%) |
96.77 |
93.65 - 97.49 |
1.7166 times |
Wed 19 November 2025 |
95.14 (-1.17%) |
96.00 |
94.43 - 97.43 |
0.6983 times |
Weekly price and charts ItronInc Strong weekly Stock price targets for ItronInc ITRI are 97.76 and 101.3 | Weekly Target 1 | 94.93 | | Weekly Target 2 | 97.04 | | Weekly Target 3 | 98.466666666667 | | Weekly Target 4 | 100.58 | | Weekly Target 5 | 102.01 |
Weekly price and volumes for Itron Inc
| Date |
Closing |
Open |
Range |
Volume |
Thu 04 December 2025 |
99.16 (0.12%) |
98.36 |
96.35 - 99.89 |
0.4434 times |
Fri 28 November 2025 |
99.04 (3.5%) |
95.83 |
95.75 - 99.35 |
0.6333 times |
Fri 21 November 2025 |
95.69 (-2.81%) |
98.87 |
93.41 - 100.44 |
0.9392 times |
Fri 14 November 2025 |
98.46 (-6.49%) |
105.32 |
97.56 - 105.99 |
1.062 times |
Fri 07 November 2025 |
105.29 (4.94%) |
104.50 |
101.80 - 108.06 |
1.0148 times |
Fri 31 October 2025 |
100.33 (0%) |
111.70 |
99.50 - 112.00 |
0.9239 times |
Fri 31 October 2025 |
100.33 (-26.2%) |
136.86 |
99.50 - 142.00 |
2.8954 times |
Fri 24 October 2025 |
135.94 (3.51%) |
132.49 |
131.38 - 137.91 |
0.7525 times |
Fri 17 October 2025 |
131.33 (7.47%) |
124.52 |
124.30 - 136.10 |
0.7754 times |
Fri 10 October 2025 |
122.20 (-2.58%) |
126.54 |
122.13 - 129.99 |
0.5601 times |
Fri 03 October 2025 |
125.44 (1.19%) |
124.53 |
121.33 - 126.02 |
0.5212 times |
Monthly price and charts ItronInc Strong monthly Stock price targets for ItronInc ITRI are 97.76 and 101.3 | Monthly Target 1 | 94.93 | | Monthly Target 2 | 97.04 | | Monthly Target 3 | 98.466666666667 | | Monthly Target 4 | 100.58 | | Monthly Target 5 | 102.01 |
Monthly price and volumes Itron Inc
| Date |
Closing |
Open |
Range |
Volume |
Thu 04 December 2025 |
99.16 (0.12%) |
98.36 |
96.35 - 99.89 |
0.1545 times |
Fri 28 November 2025 |
99.04 (-1.29%) |
104.50 |
93.41 - 108.06 |
1.2718 times |
Fri 31 October 2025 |
100.33 (-19.45%) |
124.37 |
99.50 - 142.00 |
2.1535 times |
Tue 30 September 2025 |
124.56 (1.32%) |
121.29 |
117.14 - 126.87 |
1.1537 times |
Fri 29 August 2025 |
122.94 (-1.28%) |
126.33 |
121.09 - 128.68 |
0.9349 times |
Thu 31 July 2025 |
124.54 (-5.39%) |
131.20 |
122.89 - 140.04 |
0.978 times |
Mon 30 June 2025 |
131.63 (13.87%) |
115.41 |
115.37 - 134.52 |
0.8834 times |
Fri 30 May 2025 |
115.60 (3.87%) |
108.21 |
104.98 - 116.59 |
0.827 times |
Wed 30 April 2025 |
111.29 (6.23%) |
104.57 |
90.11 - 111.72 |
0.879 times |
Mon 31 March 2025 |
104.76 (-3.79%) |
108.67 |
101.18 - 109.57 |
0.7643 times |
Fri 28 February 2025 |
108.89 (1.43%) |
104.95 |
91.84 - 109.11 |
1.2429 times |
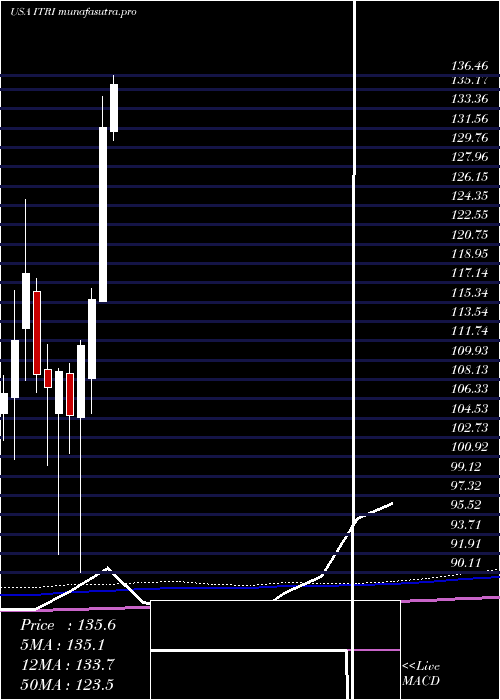
DMA SMA EMA moving averages of Itron Inc ITRI
DMA (daily moving average) of Itron Inc ITRI
| DMA period | DMA value | | 5 day DMA | 98.11 | | 12 day DMA | 97.01 | | 20 day DMA | 98.99 | | 35 day DMA | 109.92 | | 50 day DMA | 114.7 | | 100 day DMA | 120.3 | | 150 day DMA | 120.68 | | 200 day DMA | 116.39 | EMA (exponential moving average) of Itron Inc ITRI
| EMA period | EMA current | EMA prev | EMA prev2 | | 5 day EMA | 98.17 | 97.67 | 97.34 | | 12 day EMA | 98.64 | 98.54 | 98.58 | | 20 day EMA | 101.21 | 101.43 | 101.75 | | 35 day EMA | 106.84 | 107.29 | 107.82 | | 50 day EMA | 113.73 | 114.32 | 114.97 |
SMA (simple moving average) of Itron Inc ITRI
| SMA period | SMA current | SMA prev | SMA prev2 | | 5 day SMA | 98.11 | 97.99 | 97.72 | | 12 day SMA | 97.01 | 96.85 | 96.86 | | 20 day SMA | 98.99 | 99.39 | 99.8 | | 35 day SMA | 109.92 | 110.9 | 111.82 | | 50 day SMA | 114.7 | 115.18 | 115.71 | | 100 day SMA | 120.3 | 120.66 | 121.03 | | 150 day SMA | 120.68 | 120.76 | 120.84 | | 200 day SMA | 116.39 | 116.38 | 116.38 |
|
|
