GartnerInc IT full analysis,charts,indicators,moving averages,SMA,DMA,EMA,ADX,MACD,RSIGartner Inc IT WideScreen charts, DMA,SMA,EMA technical analysis, forecast prediction, by indicators ADX,MACD,RSI,CCI USA stock exchange
operates under Consumer Services sector & deals in Other Consumer Services
Daily price and charts and targets GartnerInc Strong Daily Stock price targets for GartnerInc IT are 228.57 and 233.92 | Daily Target 1 | 227.39 | | Daily Target 2 | 229.75 | | Daily Target 3 | 232.74333333333 | | Daily Target 4 | 235.1 | | Daily Target 5 | 238.09 |
Daily price and volume Gartner Inc
| Date |
Closing |
Open |
Range |
Volume |
Thu 04 December 2025 |
232.10 (0.08%) |
233.87 |
230.39 - 235.74 |
0.8142 times |
Wed 03 December 2025 |
231.91 (1.44%) |
228.66 |
227.66 - 232.43 |
0.8762 times |
Tue 02 December 2025 |
228.62 (-0.94%) |
230.55 |
226.96 - 230.60 |
1.35 times |
Mon 01 December 2025 |
230.78 (-0.84%) |
231.77 |
230.20 - 235.00 |
1.1862 times |
Fri 28 November 2025 |
232.74 (0.64%) |
230.80 |
230.61 - 233.63 |
0.5165 times |
Wed 26 November 2025 |
231.25 (-1.75%) |
234.88 |
230.88 - 236.04 |
0.7827 times |
Tue 25 November 2025 |
235.38 (2.27%) |
229.48 |
229.48 - 236.11 |
0.9137 times |
Mon 24 November 2025 |
230.16 (-1.72%) |
234.38 |
227.03 - 235.70 |
0.6698 times |
Fri 21 November 2025 |
234.18 (4.48%) |
223.55 |
223.07 - 240.25 |
1.8041 times |
Thu 20 November 2025 |
224.13 (-0.78%) |
227.14 |
222.60 - 228.45 |
1.0866 times |
Wed 19 November 2025 |
225.89 (-0.19%) |
226.36 |
222.85 - 228.32 |
1.0017 times |
Weekly price and charts GartnerInc Strong weekly Stock price targets for GartnerInc IT are 229.53 and 238.31 | Weekly Target 1 | 222.82 | | Weekly Target 2 | 227.46 | | Weekly Target 3 | 231.6 | | Weekly Target 4 | 236.24 | | Weekly Target 5 | 240.38 |
Weekly price and volumes for Gartner Inc
| Date |
Closing |
Open |
Range |
Volume |
Thu 04 December 2025 |
232.10 (-0.27%) |
231.77 |
226.96 - 235.74 |
0.9171 times |
Fri 28 November 2025 |
232.74 (-0.61%) |
234.38 |
227.03 - 236.11 |
0.6255 times |
Fri 21 November 2025 |
234.18 (1.36%) |
230.05 |
222.60 - 240.25 |
1.3172 times |
Fri 14 November 2025 |
231.03 (0.2%) |
230.91 |
225.29 - 234.10 |
1.1329 times |
Fri 07 November 2025 |
230.57 (-7.16%) |
252.37 |
222.54 - 253.54 |
1.3427 times |
Fri 31 October 2025 |
248.34 (0%) |
247.02 |
244.50 - 249.38 |
0.2318 times |
Fri 31 October 2025 |
248.34 (-0.75%) |
252.29 |
244.50 - 257.69 |
1.1859 times |
Fri 24 October 2025 |
250.21 (6.14%) |
237.99 |
236.15 - 261.10 |
1.2332 times |
Fri 17 October 2025 |
235.73 (-3.89%) |
242.25 |
234.00 - 249.45 |
1.4619 times |
Tue 07 October 2025 |
245.27 (-4.64%) |
259.00 |
245.01 - 260.67 |
0.5518 times |
Fri 03 October 2025 |
257.20 (-2.61%) |
265.62 |
242.26 - 265.62 |
2.1403 times |
Monthly price and charts GartnerInc Strong monthly Stock price targets for GartnerInc IT are 229.53 and 238.31 | Monthly Target 1 | 222.82 | | Monthly Target 2 | 227.46 | | Monthly Target 3 | 231.6 | | Monthly Target 4 | 236.24 | | Monthly Target 5 | 240.38 |
Monthly price and volumes Gartner Inc
| Date |
Closing |
Open |
Range |
Volume |
Thu 04 December 2025 |
232.10 (-0.27%) |
231.77 |
226.96 - 235.74 |
0.1781 times |
Fri 28 November 2025 |
232.74 (-6.28%) |
252.37 |
222.54 - 253.54 |
0.8583 times |
Fri 31 October 2025 |
248.34 (-5.53%) |
261.90 |
234.00 - 264.91 |
1.1392 times |
Tue 30 September 2025 |
262.87 (4.65%) |
248.26 |
231.33 - 265.85 |
1.8512 times |
Fri 29 August 2025 |
251.19 (-25.83%) |
334.66 |
223.65 - 335.84 |
1.9408 times |
Thu 31 July 2025 |
338.65 (-16.22%) |
403.54 |
337.40 - 409.76 |
0.9921 times |
Mon 30 June 2025 |
404.22 (-7.38%) |
432.27 |
390.16 - 434.12 |
0.8801 times |
Fri 30 May 2025 |
436.42 (3.64%) |
421.63 |
409.98 - 451.73 |
0.6346 times |
Wed 30 April 2025 |
421.08 (0.32%) |
416.85 |
366.05 - 425.14 |
0.7592 times |
Mon 31 March 2025 |
419.74 (-15.77%) |
498.50 |
409.50 - 499.72 |
0.7664 times |
Fri 28 February 2025 |
498.32 (-8.2%) |
536.56 |
485.86 - 584.01 |
0.5034 times |
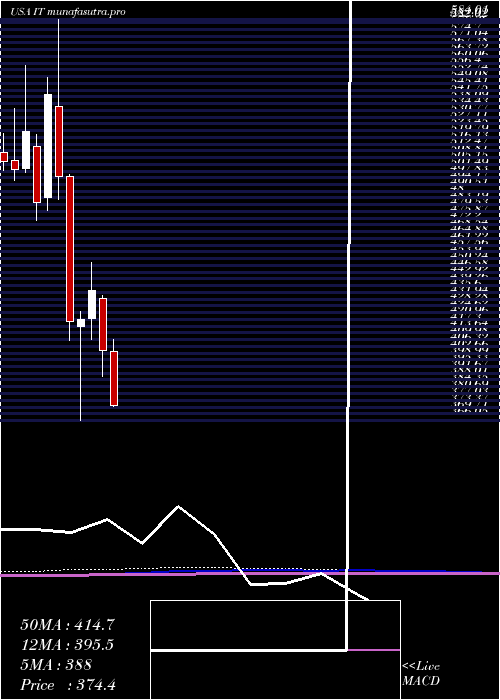
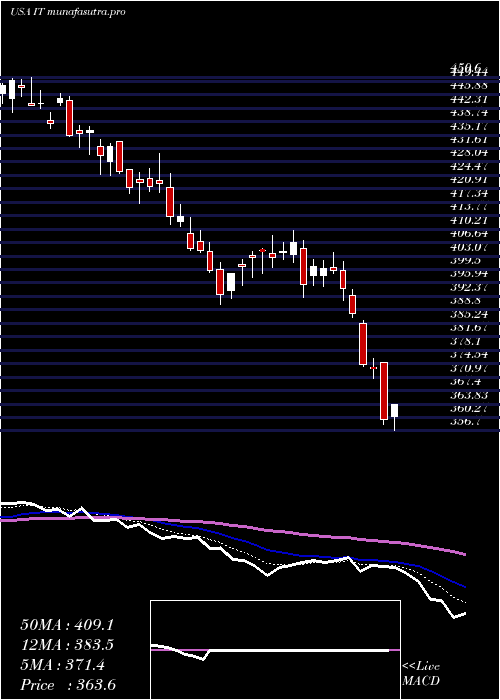
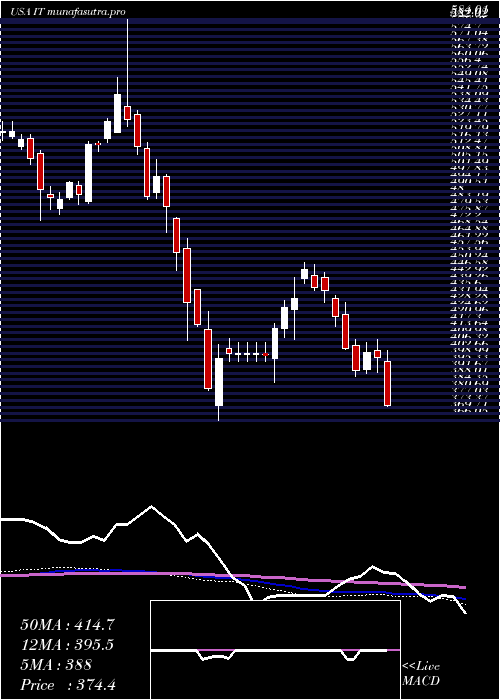
DMA SMA EMA moving averages of Gartner Inc IT
DMA (daily moving average) of Gartner Inc IT
| DMA period | DMA value | | 5 day DMA | 231.23 | | 12 day DMA | 230.29 | | 20 day DMA | 229.94 | | 35 day DMA | 236.8 | | 50 day DMA | 242.31 | | 100 day DMA | 260.81 | | 150 day DMA | 314.44 | | 200 day DMA | 346.32 | EMA (exponential moving average) of Gartner Inc IT
| EMA period | EMA current | EMA prev | EMA prev2 | | 5 day EMA | 231.35 | 230.98 | 230.52 | | 12 day EMA | 231.32 | 231.18 | 231.05 | | 20 day EMA | 232.77 | 232.84 | 232.94 | | 35 day EMA | 236.8 | 237.08 | 237.38 | | 50 day EMA | 242.02 | 242.42 | 242.85 |
SMA (simple moving average) of Gartner Inc IT
| SMA period | SMA current | SMA prev | SMA prev2 | | 5 day SMA | 231.23 | 231.06 | 231.75 | | 12 day SMA | 230.29 | 229.85 | 229.78 | | 20 day SMA | 229.94 | 230.19 | 229.96 | | 35 day SMA | 236.8 | 236.93 | 237.36 | | 50 day SMA | 242.31 | 242.8 | 243.22 | | 100 day SMA | 260.81 | 262.37 | 263.99 | | 150 day SMA | 314.44 | 315.66 | 316.9 | | 200 day SMA | 346.32 | 347.74 | 349.15 |
|
|
