InnovativeSolutions ISSC full analysis,charts,indicators,moving averages,SMA,DMA,EMA,ADX,MACD,RSIInnovative Solutions ISSC WideScreen charts, DMA,SMA,EMA technical analysis, forecast prediction, by indicators ADX,MACD,RSI,CCI USA stock exchange
operates under Technology sector & deals in EDP Services
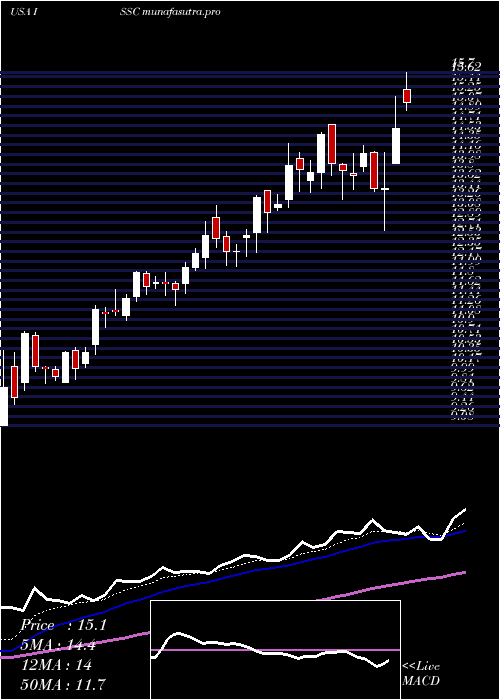
Daily price and charts and targets InnovativeSolutions Strong Daily Stock price targets for InnovativeSolutions ISSC are 10.88 and 11.53 | Daily Target 1 | 10.41 | | Daily Target 2 | 10.7 | | Daily Target 3 | 11.056666666667 | | Daily Target 4 | 11.35 | | Daily Target 5 | 11.71 |
Daily price and volume Innovative Solutions
| Date |
Closing |
Open |
Range |
Volume |
Mon 20 October 2025 |
11.00 (2.33%) |
10.85 |
10.76 - 11.41 |
1.9046 times |
Fri 17 October 2025 |
10.75 (-3.59%) |
11.01 |
10.37 - 11.12 |
0.9412 times |
Thu 16 October 2025 |
11.15 (-4.37%) |
11.65 |
11.14 - 11.75 |
1.1167 times |
Wed 15 October 2025 |
11.66 (-2.18%) |
12.02 |
11.63 - 12.11 |
0.7346 times |
Tue 14 October 2025 |
11.92 (1.19%) |
11.58 |
11.36 - 12.06 |
0.753 times |
Mon 13 October 2025 |
11.78 (2.35%) |
11.74 |
11.63 - 11.96 |
0.5662 times |
Fri 10 October 2025 |
11.51 (-4%) |
12.03 |
11.43 - 12.22 |
1.0199 times |
Thu 09 October 2025 |
11.99 (-0.17%) |
12.07 |
11.92 - 12.35 |
0.7228 times |
Wed 08 October 2025 |
12.01 (-3.38%) |
12.55 |
11.86 - 12.60 |
1.4425 times |
Tue 07 October 2025 |
12.43 (0.57%) |
12.33 |
12.26 - 12.65 |
0.7986 times |
Mon 06 October 2025 |
12.36 (2.49%) |
12.30 |
12.06 - 12.44 |
0.5402 times |
Weekly price and charts InnovativeSolutions Strong weekly Stock price targets for InnovativeSolutions ISSC are 10.88 and 11.53 | Weekly Target 1 | 10.41 | | Weekly Target 2 | 10.7 | | Weekly Target 3 | 11.056666666667 | | Weekly Target 4 | 11.35 | | Weekly Target 5 | 11.71 |
Weekly price and volumes for Innovative Solutions
| Date |
Closing |
Open |
Range |
Volume |
Mon 20 October 2025 |
11.00 (2.33%) |
10.85 |
10.76 - 11.41 |
0.3061 times |
Fri 17 October 2025 |
10.75 (-6.6%) |
11.74 |
10.37 - 12.11 |
0.6609 times |
Fri 10 October 2025 |
11.51 (-4.56%) |
12.30 |
11.43 - 12.65 |
0.7271 times |
Fri 03 October 2025 |
12.06 (1.77%) |
12.06 |
11.95 - 12.79 |
0.7866 times |
Fri 26 September 2025 |
11.85 (3.95%) |
11.50 |
11.42 - 12.61 |
0.8908 times |
Fri 19 September 2025 |
11.40 (2.24%) |
11.15 |
10.83 - 11.52 |
1.2587 times |
Fri 12 September 2025 |
11.15 (-4.04%) |
11.59 |
10.95 - 11.74 |
1.2875 times |
Fri 05 September 2025 |
11.62 (-10.27%) |
12.71 |
11.57 - 12.94 |
1.6879 times |
Fri 29 August 2025 |
12.95 (0%) |
13.31 |
12.69 - 13.36 |
0.437 times |
Fri 29 August 2025 |
12.95 (-9%) |
13.64 |
12.69 - 14.06 |
1.9574 times |
Fri 22 August 2025 |
14.23 (4.02%) |
13.79 |
12.17 - 14.60 |
2.3741 times |
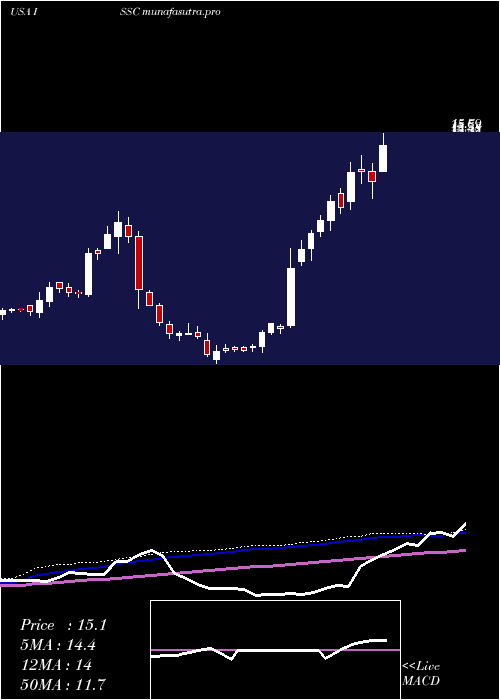
Monthly price and charts InnovativeSolutions Strong monthly Stock price targets for InnovativeSolutions ISSC are 9.48 and 11.9 | Monthly Target 1 | 8.97 | | Monthly Target 2 | 9.98 | | Monthly Target 3 | 11.386666666667 | | Monthly Target 4 | 12.4 | | Monthly Target 5 | 13.81 |
Monthly price and volumes Innovative Solutions
| Date |
Closing |
Open |
Range |
Volume |
Mon 20 October 2025 |
11.00 (-11.93%) |
12.35 |
10.37 - 12.79 |
0.4946 times |
Tue 30 September 2025 |
12.49 (-3.55%) |
12.71 |
10.83 - 12.94 |
1.2931 times |
Fri 29 August 2025 |
12.95 (-16.67%) |
15.24 |
12.17 - 20.00 |
2.8706 times |
Thu 31 July 2025 |
15.54 (11.96%) |
13.67 |
12.74 - 16.82 |
1.6983 times |
Mon 30 June 2025 |
13.88 (24.04%) |
11.25 |
11.06 - 14.37 |
0.7459 times |
Fri 30 May 2025 |
11.19 (66.02%) |
6.81 |
6.64 - 11.33 |
0.669 times |
Wed 30 April 2025 |
6.74 (7.15%) |
6.24 |
5.30 - 6.96 |
0.2181 times |
Mon 31 March 2025 |
6.29 (-11.9%) |
7.08 |
6.17 - 7.20 |
0.321 times |
Fri 28 February 2025 |
7.14 (-38.82%) |
11.54 |
7.03 - 11.92 |
0.8522 times |
Fri 31 January 2025 |
11.67 (36.65%) |
8.52 |
8.30 - 12.17 |
0.8373 times |
Tue 31 December 2024 |
8.54 (10.62%) |
7.90 |
7.36 - 8.97 |
0.3818 times |
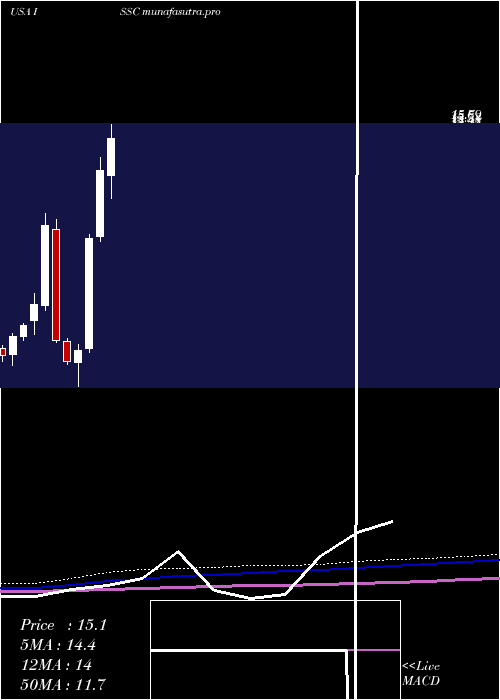
DMA SMA EMA moving averages of Innovative Solutions ISSC
DMA (daily moving average) of Innovative Solutions ISSC
| DMA period | DMA value | | 5 day DMA | 11.3 | | 12 day DMA | 11.72 | | 20 day DMA | 11.91 | | 35 day DMA | 11.73 | | 50 day DMA | 12.5 | | 100 day DMA | 13.23 | | 150 day DMA | 11.18 | | 200 day DMA | 10.66 | EMA (exponential moving average) of Innovative Solutions ISSC
| EMA period | EMA current | EMA prev | EMA prev2 | | 5 day EMA | 11.21 | 11.31 | 11.59 | | 12 day EMA | 11.55 | 11.65 | 11.81 | | 20 day EMA | 11.76 | 11.84 | 11.96 | | 35 day EMA | 12.34 | 12.42 | 12.52 | | 50 day EMA | 12.78 | 12.85 | 12.94 |
SMA (simple moving average) of Innovative Solutions ISSC
| SMA period | SMA current | SMA prev | SMA prev2 | | 5 day SMA | 11.3 | 11.45 | 11.6 | | 12 day SMA | 11.72 | 11.84 | 11.98 | | 20 day SMA | 11.91 | 11.96 | 12 | | 35 day SMA | 11.73 | 11.78 | 11.85 | | 50 day SMA | 12.5 | 12.65 | 12.79 | | 100 day SMA | 13.23 | 13.23 | 13.22 | | 150 day SMA | 11.18 | 11.15 | 11.12 | | 200 day SMA | 10.66 | 10.64 | 10.63 |
|
|
