IsramcoInc ISRL full analysis,charts,indicators,moving averages,SMA,DMA,EMA,ADX,MACD,RSIIsramco Inc ISRL WideScreen charts, DMA,SMA,EMA technical analysis, forecast prediction, by indicators ADX,MACD,RSI,CCI USA stock exchange
operates under Energy sector & deals in Oil Gas Production
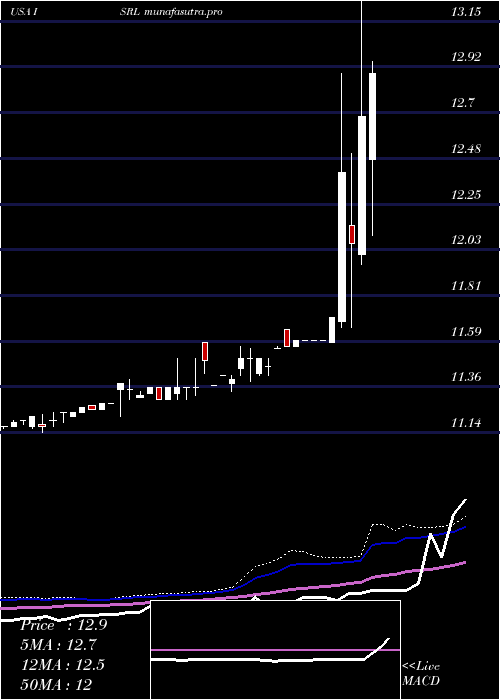
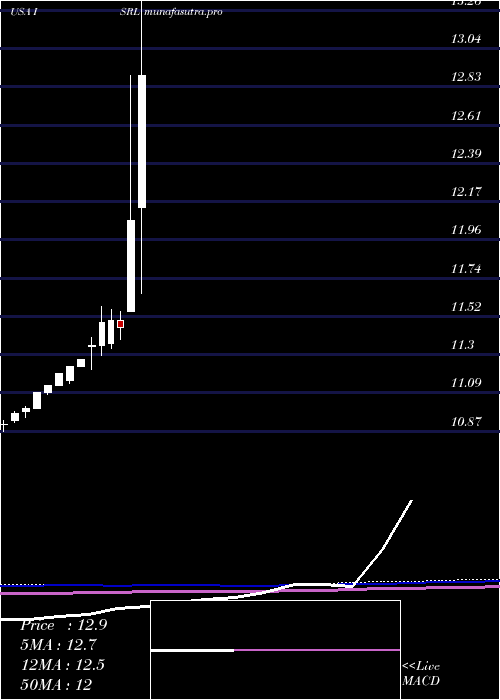
Daily price and charts and targets IsramcoInc Strong Daily Stock price targets for IsramcoInc ISRL are 12.4 and 12.4 | Daily Target 1 | 12.4 | | Daily Target 2 | 12.4 | | Daily Target 3 | 12.4 | | Daily Target 4 | 12.4 | | Daily Target 5 | 12.4 |
Daily price and volume Isramco Inc
| Date |
Closing |
Open |
Range |
Volume |
Fri 17 October 2025 |
12.40 (0%) |
12.40 |
12.40 - 12.40 |
0.0161 times |
Thu 16 October 2025 |
12.40 (0.4%) |
12.35 |
12.35 - 12.40 |
0.2576 times |
Wed 15 October 2025 |
12.35 (0%) |
12.35 |
12.28 - 12.37 |
1.3446 times |
Tue 14 October 2025 |
12.35 (0.57%) |
12.35 |
12.35 - 12.35 |
0.0242 times |
Mon 13 October 2025 |
12.28 (0.16%) |
12.35 |
12.28 - 12.35 |
0.1047 times |
Fri 10 October 2025 |
12.26 (0%) |
12.35 |
12.26 - 12.35 |
0.1852 times |
Thu 09 October 2025 |
12.26 (-1.13%) |
12.40 |
12.26 - 12.40 |
0.2254 times |
Wed 08 October 2025 |
12.40 (0.32%) |
12.36 |
12.09 - 12.50 |
4.4444 times |
Tue 07 October 2025 |
12.36 (-4.92%) |
12.31 |
11.81 - 13.00 |
3.277 times |
Mon 06 October 2025 |
13.00 (2.36%) |
12.56 |
12.41 - 13.00 |
0.1208 times |
Fri 03 October 2025 |
12.70 (0.24%) |
12.41 |
12.41 - 12.70 |
0.1127 times |

Weekly price and charts IsramcoInc Strong weekly Stock price targets for IsramcoInc ISRL are 12.34 and 12.46 | Weekly Target 1 | 12.24 | | Weekly Target 2 | 12.32 | | Weekly Target 3 | 12.36 | | Weekly Target 4 | 12.44 | | Weekly Target 5 | 12.48 |
Weekly price and volumes for Isramco Inc
| Date |
Closing |
Open |
Range |
Volume |
Fri 17 October 2025 |
12.40 (1.14%) |
12.35 |
12.28 - 12.40 |
1.0664 times |
Fri 10 October 2025 |
12.26 (-3.46%) |
12.56 |
11.81 - 13.00 |
5.0374 times |
Fri 03 October 2025 |
12.70 (-2.31%) |
12.25 |
12.16 - 12.70 |
1.6994 times |
Thu 25 September 2025 |
13.00 (2.77%) |
12.22 |
12.22 - 13.00 |
0.1622 times |
Fri 19 September 2025 |
12.65 (0%) |
12.28 |
12.11 - 12.65 |
0.1622 times |
Tue 09 September 2025 |
12.65 (1.2%) |
12.56 |
12.56 - 12.65 |
0.0639 times |
Fri 05 September 2025 |
12.50 (-0.71%) |
12.47 |
11.99 - 12.70 |
1.5825 times |
Fri 29 August 2025 |
12.59 (0%) |
12.50 |
12.50 - 12.59 |
0.0246 times |
Fri 29 August 2025 |
12.59 (-1.64%) |
12.66 |
12.40 - 12.66 |
0.0835 times |
Fri 22 August 2025 |
12.80 (0.79%) |
12.55 |
12.40 - 13.00 |
0.1179 times |
Fri 15 August 2025 |
12.70 (0.79%) |
12.70 |
11.81 - 12.71 |
1.44 times |
Monthly price and charts IsramcoInc Strong monthly Stock price targets for IsramcoInc ISRL are 11.51 and 12.7 | Monthly Target 1 | 11.21 | | Monthly Target 2 | 11.81 | | Monthly Target 3 | 12.403333333333 | | Monthly Target 4 | 13 | | Monthly Target 5 | 13.59 |
Monthly price and volumes Isramco Inc
| Date |
Closing |
Open |
Range |
Volume |
Fri 17 October 2025 |
12.40 (-1.43%) |
12.45 |
11.81 - 13.00 |
0.8565 times |
Tue 30 September 2025 |
12.58 (-0.08%) |
12.47 |
11.99 - 13.00 |
0.485 times |
Fri 29 August 2025 |
12.59 (1.53%) |
12.04 |
11.81 - 13.00 |
0.342 times |
Thu 31 July 2025 |
12.40 (-2.36%) |
12.54 |
12.03 - 12.98 |
0.5803 times |
Mon 30 June 2025 |
12.70 (-0.24%) |
12.73 |
12.31 - 13.90 |
2.273 times |
Fri 30 May 2025 |
12.73 (5.47%) |
12.14 |
11.65 - 14.00 |
2.1537 times |
Wed 30 April 2025 |
12.07 (5.32%) |
11.55 |
11.55 - 12.89 |
2.6581 times |
Wed 19 March 2025 |
11.46 (-0.35%) |
11.50 |
11.39 - 11.55 |
0.2524 times |
Fri 28 February 2025 |
11.50 (0.09%) |
11.37 |
11.34 - 11.56 |
0.1943 times |
Thu 30 January 2025 |
11.49 (1.14%) |
11.36 |
11.30 - 11.58 |
0.2049 times |
Mon 30 December 2024 |
11.36 (0.71%) |
11.35 |
11.22 - 11.40 |
5.2062 times |
DMA SMA EMA moving averages of Isramco Inc ISRL
DMA (daily moving average) of Isramco Inc ISRL
| DMA period | DMA value | | 5 day DMA | 12.36 | | 12 day DMA | 12.45 | | 20 day DMA | 12.49 | | 35 day DMA | 12.53 | | 50 day DMA | 12.53 | | 100 day DMA | 12.52 | | 150 day DMA | 12.16 | | 200 day DMA | 11.93 | EMA (exponential moving average) of Isramco Inc ISRL
| EMA period | EMA current | EMA prev | EMA prev2 | | 5 day EMA | 12.38 | 12.37 | 12.35 | | 12 day EMA | 12.43 | 12.43 | 12.43 | | 20 day EMA | 12.46 | 12.47 | 12.48 | | 35 day EMA | 12.49 | 12.5 | 12.51 | | 50 day EMA | 12.51 | 12.51 | 12.51 |
SMA (simple moving average) of Isramco Inc ISRL
| SMA period | SMA current | SMA prev | SMA prev2 | | 5 day SMA | 12.36 | 12.33 | 12.3 | | 12 day SMA | 12.45 | 12.47 | 12.45 | | 20 day SMA | 12.49 | 12.51 | 12.51 | | 35 day SMA | 12.53 | 12.53 | 12.54 | | 50 day SMA | 12.53 | 12.53 | 12.53 | | 100 day SMA | 12.52 | 12.51 | 12.5 | | 150 day SMA | 12.16 | 12.15 | 12.14 | | 200 day SMA | 11.93 | 11.92 | 11.91 |
|
|
