IrsaInversiones IRS full analysis,charts,indicators,moving averages,SMA,DMA,EMA,ADX,MACD,RSIIrsa Inversiones IRS WideScreen charts, DMA,SMA,EMA technical analysis, forecast prediction, by indicators ADX,MACD,RSI,CCI USA stock exchange
operates under Consumer Services sector & deals in Homebuilding
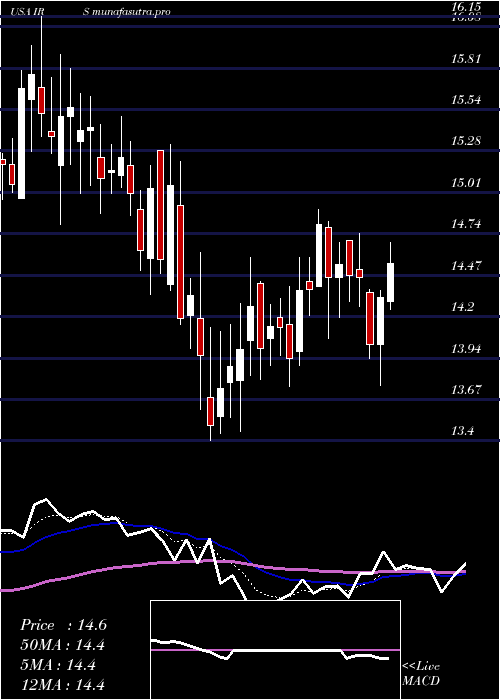
Daily price and charts and targets IrsaInversiones Strong Daily Stock price targets for IrsaInversiones IRS are 11.42 and 12.13 | Daily Target 1 | 10.9 | | Daily Target 2 | 11.22 | | Daily Target 3 | 11.613333333333 | | Daily Target 4 | 11.93 | | Daily Target 5 | 12.32 |
Daily price and volume Irsa Inversiones
| Date |
Closing |
Open |
Range |
Volume |
Tue 21 October 2025 |
11.53 (1.32%) |
11.37 |
11.30 - 12.01 |
1.496 times |
Mon 20 October 2025 |
11.38 (-2.49%) |
11.75 |
11.17 - 11.78 |
0.6969 times |
Fri 17 October 2025 |
11.67 (-0.43%) |
11.94 |
11.55 - 11.94 |
0.5745 times |
Thu 16 October 2025 |
11.72 (-1.1%) |
11.97 |
11.55 - 12.04 |
0.5713 times |
Wed 15 October 2025 |
11.85 (0.34%) |
11.92 |
11.77 - 12.25 |
0.9485 times |
Tue 14 October 2025 |
11.81 (-3.12%) |
11.90 |
11.68 - 12.35 |
1.4314 times |
Mon 13 October 2025 |
12.19 (7.31%) |
11.84 |
11.82 - 12.36 |
1.3119 times |
Tue 07 October 2025 |
11.36 (-1.22%) |
11.40 |
11.25 - 11.61 |
1.1447 times |
Mon 06 October 2025 |
11.50 (0%) |
11.64 |
11.37 - 11.65 |
0.987 times |
Fri 03 October 2025 |
11.50 (-1.37%) |
11.67 |
11.40 - 11.91 |
0.8378 times |
Thu 02 October 2025 |
11.66 (0.78%) |
11.65 |
11.25 - 11.80 |
0.9558 times |
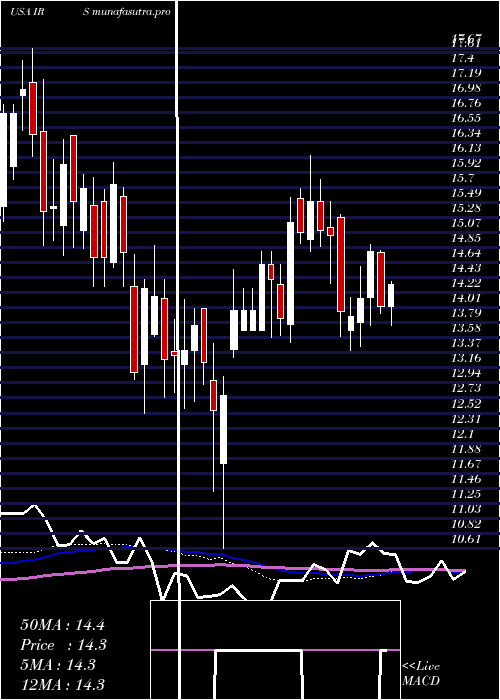
Weekly price and charts IrsaInversiones Strong weekly Stock price targets for IrsaInversiones IRS are 10.93 and 11.77 | Weekly Target 1 | 10.73 | | Weekly Target 2 | 11.13 | | Weekly Target 3 | 11.57 | | Weekly Target 4 | 11.97 | | Weekly Target 5 | 12.41 |
Weekly price and volumes for Irsa Inversiones
| Date |
Closing |
Open |
Range |
Volume |
Tue 21 October 2025 |
11.53 (-1.2%) |
11.75 |
11.17 - 12.01 |
0.4992 times |
Fri 17 October 2025 |
11.67 (2.73%) |
11.84 |
11.55 - 12.36 |
1.1013 times |
Tue 07 October 2025 |
11.36 (-1.22%) |
11.64 |
11.25 - 11.65 |
0.4853 times |
Fri 03 October 2025 |
11.50 (-3.93%) |
12.10 |
11.25 - 12.43 |
1.0485 times |
Fri 26 September 2025 |
11.97 (0.67%) |
12.50 |
11.87 - 13.38 |
1.2985 times |
Fri 19 September 2025 |
11.89 (0.08%) |
11.88 |
11.29 - 12.87 |
1.3256 times |
Fri 12 September 2025 |
11.88 (-17.1%) |
12.04 |
11.33 - 13.34 |
1.9169 times |
Fri 05 September 2025 |
14.33 (-2.52%) |
14.38 |
13.71 - 14.67 |
0.91 times |
Fri 29 August 2025 |
14.70 (0%) |
14.82 |
14.15 - 14.91 |
0.0973 times |
Fri 29 August 2025 |
14.70 (-3.03%) |
15.04 |
14.13 - 15.06 |
1.3173 times |
Fri 22 August 2025 |
15.16 (-1.94%) |
15.45 |
14.80 - 15.83 |
0.4538 times |
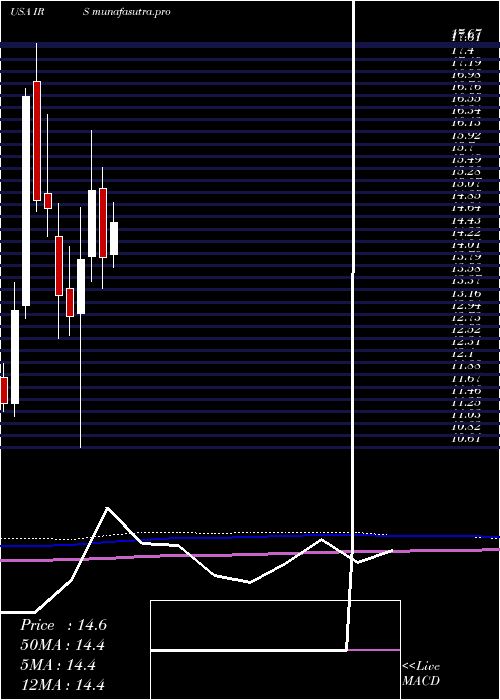
Monthly price and charts IrsaInversiones Strong monthly Stock price targets for IrsaInversiones IRS are 10.76 and 11.95 | Monthly Target 1 | 10.5 | | Monthly Target 2 | 11.01 | | Monthly Target 3 | 11.686666666667 | | Monthly Target 4 | 12.2 | | Monthly Target 5 | 12.88 |
Monthly price and volumes Irsa Inversiones
| Date |
Closing |
Open |
Range |
Volume |
Tue 21 October 2025 |
11.53 (-2.62%) |
11.79 |
11.17 - 12.36 |
0.901 times |
Tue 30 September 2025 |
11.84 (-19.46%) |
14.38 |
11.29 - 14.67 |
1.972 times |
Fri 29 August 2025 |
14.70 (-1.28%) |
14.92 |
14.13 - 16.83 |
1.0226 times |
Thu 31 July 2025 |
14.89 (6.89%) |
13.98 |
13.76 - 16.43 |
1.0799 times |
Mon 30 June 2025 |
13.93 (-7.75%) |
15.14 |
13.40 - 15.50 |
0.7582 times |
Fri 30 May 2025 |
15.10 (8.71%) |
13.95 |
13.51 - 16.15 |
0.7584 times |
Wed 30 April 2025 |
13.89 (7.67%) |
12.96 |
10.61 - 14.80 |
0.8689 times |
Mon 31 March 2025 |
12.90 (-2.79%) |
13.39 |
12.58 - 14.12 |
0.5979 times |
Fri 28 February 2025 |
13.27 (-10.28%) |
14.30 |
12.52 - 14.88 |
0.7892 times |
Fri 31 January 2025 |
14.79 (-0.94%) |
15.05 |
14.30 - 16.43 |
1.2519 times |
Tue 31 December 2024 |
14.93 (-10.87%) |
17.00 |
14.74 - 17.67 |
0.835 times |
DMA SMA EMA moving averages of Irsa Inversiones IRS
DMA (daily moving average) of Irsa Inversiones IRS
| DMA period | DMA value | | 5 day DMA | 11.63 | | 12 day DMA | 11.65 | | 20 day DMA | 11.96 | | 35 day DMA | 12.43 | | 50 day DMA | 13.29 | | 100 day DMA | 14.03 | | 150 day DMA | 13.98 | | 200 day DMA | 14.09 | EMA (exponential moving average) of Irsa Inversiones IRS
| EMA period | EMA current | EMA prev | EMA prev2 | | 5 day EMA | 11.59 | 11.62 | 11.74 | | 12 day EMA | 11.74 | 11.78 | 11.85 | | 20 day EMA | 11.98 | 12.03 | 12.1 | | 35 day EMA | 12.64 | 12.71 | 12.79 | | 50 day EMA | 13.31 | 13.38 | 13.46 |
SMA (simple moving average) of Irsa Inversiones IRS
| SMA period | SMA current | SMA prev | SMA prev2 | | 5 day SMA | 11.63 | 11.69 | 11.85 | | 12 day SMA | 11.65 | 11.67 | 11.74 | | 20 day SMA | 11.96 | 11.96 | 11.99 | | 35 day SMA | 12.43 | 12.53 | 12.61 | | 50 day SMA | 13.29 | 13.38 | 13.47 | | 100 day SMA | 14.03 | 14.07 | 14.11 | | 150 day SMA | 13.98 | 14 | 14.01 | | 200 day SMA | 14.09 | 14.11 | 14.13 |
|
|
