IfBancorp IROQ full analysis,charts,indicators,moving averages,SMA,DMA,EMA,ADX,MACD,RSIIf Bancorp IROQ WideScreen charts, DMA,SMA,EMA technical analysis, forecast prediction, by indicators ADX,MACD,RSI,CCI USA stock exchange
operates under Finance sector & deals in Savings Institutions
Daily price and charts and targets IfBancorp Strong Daily Stock price targets for IfBancorp IROQ are 26.34 and 26.34 | Daily Target 1 | 26.34 | | Daily Target 2 | 26.34 | | Daily Target 3 | 26.34 | | Daily Target 4 | 26.34 | | Daily Target 5 | 26.34 |
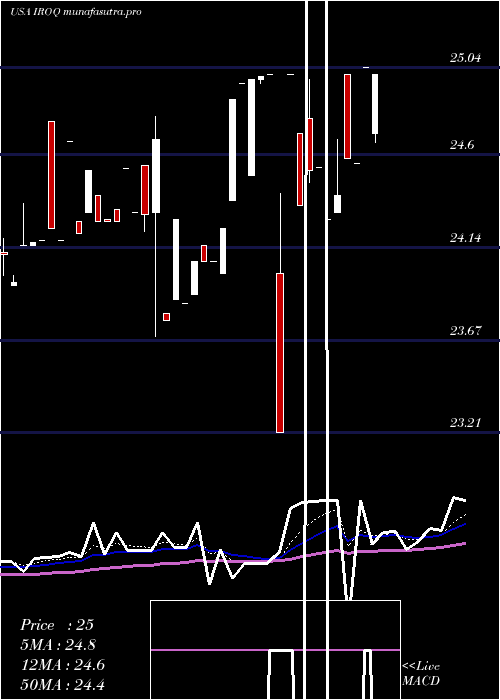
Daily price and volume If Bancorp
| Date |
Closing |
Open |
Range |
Volume |
Thu 04 December 2025 |
26.34 (0.34%) |
26.34 |
26.34 - 26.34 |
0.0581 times |
Wed 03 December 2025 |
26.25 (0.08%) |
26.25 |
26.23 - 26.25 |
5.407 times |
Tue 02 December 2025 |
26.23 (0.11%) |
26.20 |
26.20 - 26.23 |
0.9884 times |
Mon 01 December 2025 |
26.20 (0.5%) |
26.19 |
26.19 - 26.20 |
0.9884 times |
Fri 28 November 2025 |
26.07 (0.08%) |
26.07 |
26.07 - 26.07 |
0.1163 times |
Wed 26 November 2025 |
26.05 (-0.76%) |
26.20 |
26.05 - 26.25 |
0.7558 times |
Tue 25 November 2025 |
26.25 (0.77%) |
26.25 |
26.25 - 26.25 |
0.1744 times |
Mon 24 November 2025 |
26.05 (0.35%) |
26.15 |
26.05 - 26.15 |
0.9884 times |
Fri 21 November 2025 |
25.96 (-0.35%) |
26.00 |
25.96 - 26.00 |
0.3488 times |
Thu 20 November 2025 |
26.05 (0%) |
26.05 |
26.05 - 26.05 |
0.1744 times |
Wed 19 November 2025 |
26.05 (0.08%) |
26.11 |
26.00 - 26.11 |
0.9884 times |
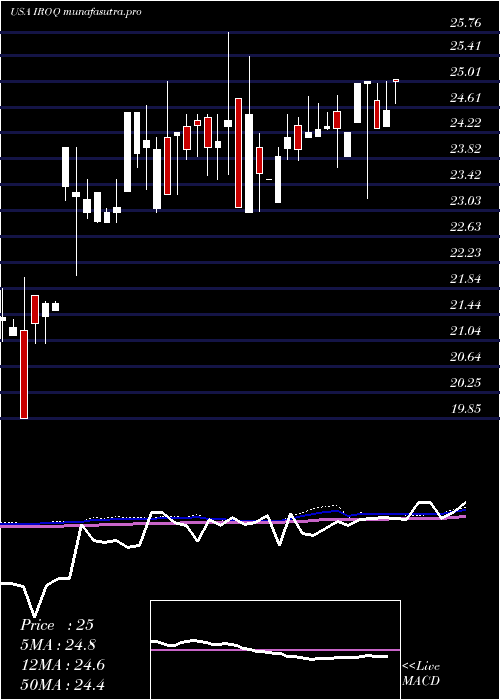
Weekly price and charts IfBancorp Strong weekly Stock price targets for IfBancorp IROQ are 26.27 and 26.42 | Weekly Target 1 | 26.14 | | Weekly Target 2 | 26.24 | | Weekly Target 3 | 26.29 | | Weekly Target 4 | 26.39 | | Weekly Target 5 | 26.44 |
Weekly price and volumes for If Bancorp
| Date |
Closing |
Open |
Range |
Volume |
Thu 04 December 2025 |
26.34 (1.04%) |
26.19 |
26.19 - 26.34 |
0.5241 times |
Fri 28 November 2025 |
26.07 (0.42%) |
26.15 |
26.05 - 26.25 |
0.1433 times |
Fri 21 November 2025 |
25.96 (0.74%) |
25.70 |
25.70 - 26.14 |
0.2948 times |
Fri 14 November 2025 |
25.77 (-0.19%) |
25.83 |
25.74 - 25.86 |
1.5723 times |
Fri 07 November 2025 |
25.82 (0.39%) |
25.72 |
25.69 - 25.97 |
2.39 times |
Fri 31 October 2025 |
25.72 (0%) |
25.82 |
25.70 - 25.82 |
1.1751 times |
Fri 31 October 2025 |
25.72 (-0.62%) |
25.39 |
25.02 - 26.50 |
3.5091 times |
Thu 16 October 2025 |
25.88 (2.25%) |
25.55 |
25.55 - 25.88 |
0.0287 times |
Fri 10 October 2025 |
25.31 (-1.71%) |
25.75 |
25.31 - 25.96 |
0.2375 times |
Fri 03 October 2025 |
25.75 (-0.77%) |
25.60 |
25.60 - 26.21 |
0.1251 times |
Fri 26 September 2025 |
25.95 (0.78%) |
25.97 |
25.77 - 26.00 |
0.4176 times |
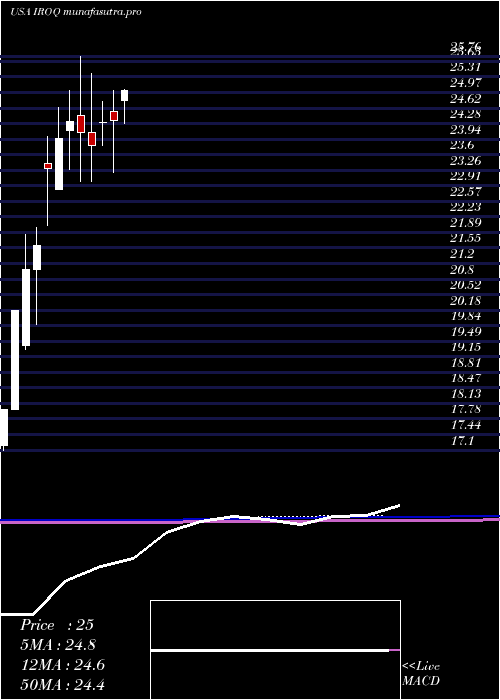
Monthly price and charts IfBancorp Strong monthly Stock price targets for IfBancorp IROQ are 26.27 and 26.42 | Monthly Target 1 | 26.14 | | Monthly Target 2 | 26.24 | | Monthly Target 3 | 26.29 | | Monthly Target 4 | 26.39 | | Monthly Target 5 | 26.44 |
Monthly price and volumes If Bancorp
| Date |
Closing |
Open |
Range |
Volume |
Thu 04 December 2025 |
26.34 (1.04%) |
26.19 |
26.19 - 26.34 |
0.273 times |
Fri 28 November 2025 |
26.07 (1.36%) |
25.72 |
25.69 - 26.25 |
2.2918 times |
Fri 31 October 2025 |
25.72 (-0.62%) |
25.75 |
25.02 - 26.50 |
2.5901 times |
Tue 30 September 2025 |
25.88 (2.41%) |
23.95 |
23.95 - 26.21 |
0.853 times |
Fri 29 August 2025 |
25.27 (1.61%) |
24.95 |
24.90 - 25.97 |
0.482 times |
Thu 31 July 2025 |
24.87 (2.14%) |
24.78 |
24.00 - 25.04 |
0.5323 times |
Mon 30 June 2025 |
24.35 (0.16%) |
24.55 |
23.21 - 25.00 |
0.6568 times |
Fri 30 May 2025 |
24.31 (2.1%) |
24.30 |
23.80 - 24.77 |
0.467 times |
Wed 30 April 2025 |
23.81 (-1.16%) |
24.09 |
23.01 - 25.39 |
0.4222 times |
Mon 31 March 2025 |
24.09 (-0.99%) |
24.46 |
23.00 - 25.76 |
1.4317 times |
Fri 28 February 2025 |
24.33 (1.54%) |
24.14 |
23.27 - 25.00 |
0.5438 times |
DMA SMA EMA moving averages of If Bancorp IROQ
DMA (daily moving average) of If Bancorp IROQ
| DMA period | DMA value | | 5 day DMA | 26.22 | | 12 day DMA | 26.13 | | 20 day DMA | 26 | | 35 day DMA | 25.85 | | 50 day DMA | 25.83 | | 100 day DMA | 25.33 | | 150 day DMA | 24.92 | | 200 day DMA | 24.65 | EMA (exponential moving average) of If Bancorp IROQ
| EMA period | EMA current | EMA prev | EMA prev2 | | 5 day EMA | 26.23 | 26.18 | 26.15 | | 12 day EMA | 26.13 | 26.09 | 26.06 | | 20 day EMA | 26.04 | 26.01 | 25.99 | | 35 day EMA | 25.93 | 25.91 | 25.89 | | 50 day EMA | 25.83 | 25.81 | 25.79 |
SMA (simple moving average) of If Bancorp IROQ
| SMA period | SMA current | SMA prev | SMA prev2 | | 5 day SMA | 26.22 | 26.16 | 26.16 | | 12 day SMA | 26.13 | 26.1 | 26.06 | | 20 day SMA | 26 | 25.98 | 25.95 | | 35 day SMA | 25.85 | 25.84 | 25.83 | | 50 day SMA | 25.83 | 25.81 | 25.79 | | 100 day SMA | 25.33 | 25.3 | 25.29 | | 150 day SMA | 24.92 | 24.91 | 24.89 | | 200 day SMA | 24.65 | 24.63 | 24.61 |
|
|
