IntrepidPotash IPI full analysis,charts,indicators,moving averages,SMA,DMA,EMA,ADX,MACD,RSIIntrepid Potash IPI WideScreen charts, DMA,SMA,EMA technical analysis, forecast prediction, by indicators ADX,MACD,RSI,CCI USA stock exchange
operates under Basic Industries sector & deals in Mining Quarrying Of Nonmetallic Minerals No Fuels
Daily price and charts and targets IntrepidPotash Strong Daily Stock price targets for IntrepidPotash IPI are 25.18 and 26.14 | Daily Target 1 | 24.77 | | Daily Target 2 | 25.22 | | Daily Target 3 | 25.733333333333 | | Daily Target 4 | 26.18 | | Daily Target 5 | 26.69 |
Daily price and volume Intrepid Potash
| Date |
Closing |
Open |
Range |
Volume |
Thu 04 December 2025 |
25.66 (-0.54%) |
25.66 |
25.29 - 26.25 |
1.0749 times |
Wed 03 December 2025 |
25.80 (0.86%) |
25.78 |
25.49 - 25.89 |
0.734 times |
Tue 02 December 2025 |
25.58 (-0.27%) |
25.79 |
25.10 - 25.79 |
1.0648 times |
Mon 01 December 2025 |
25.65 (1.38%) |
25.20 |
25.08 - 25.81 |
1.3156 times |
Fri 28 November 2025 |
25.30 (1.28%) |
24.89 |
24.71 - 25.51 |
0.4474 times |
Wed 26 November 2025 |
24.98 (-0.2%) |
25.00 |
24.70 - 25.14 |
0.6642 times |
Tue 25 November 2025 |
25.03 (1.34%) |
24.81 |
24.52 - 25.10 |
1.2935 times |
Mon 24 November 2025 |
24.70 (-0.88%) |
24.81 |
24.36 - 24.99 |
0.8985 times |
Fri 21 November 2025 |
24.92 (1.47%) |
24.56 |
24.45 - 25.34 |
1.2265 times |
Thu 20 November 2025 |
24.56 (0%) |
24.71 |
24.36 - 24.99 |
1.2807 times |
Wed 19 November 2025 |
24.56 (-0.69%) |
24.52 |
24.12 - 25.08 |
2.5191 times |
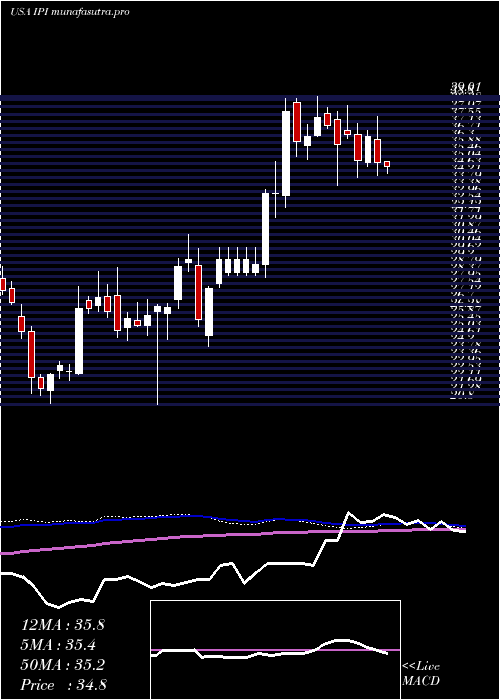
Weekly price and charts IntrepidPotash Strong weekly Stock price targets for IntrepidPotash IPI are 25.37 and 26.54 | Weekly Target 1 | 24.49 | | Weekly Target 2 | 25.08 | | Weekly Target 3 | 25.663333333333 | | Weekly Target 4 | 26.25 | | Weekly Target 5 | 26.83 |
Weekly price and volumes for Intrepid Potash
| Date |
Closing |
Open |
Range |
Volume |
Thu 04 December 2025 |
25.66 (1.42%) |
25.20 |
25.08 - 26.25 |
0.7428 times |
Fri 28 November 2025 |
25.30 (1.52%) |
24.81 |
24.36 - 25.51 |
0.5858 times |
Fri 21 November 2025 |
24.92 (-4.89%) |
25.98 |
24.12 - 25.98 |
1.2313 times |
Fri 14 November 2025 |
26.20 (3.93%) |
25.32 |
25.10 - 27.33 |
1.2507 times |
Fri 07 November 2025 |
25.21 (-5.33%) |
25.89 |
22.55 - 26.30 |
1.5157 times |
Fri 31 October 2025 |
26.63 (0%) |
26.78 |
26.42 - 26.84 |
0.1469 times |
Fri 31 October 2025 |
26.63 (-5.67%) |
28.34 |
26.29 - 28.48 |
1.0021 times |
Fri 24 October 2025 |
28.23 (3.1%) |
27.69 |
27.06 - 28.67 |
1.1862 times |
Fri 17 October 2025 |
27.38 (-9.82%) |
28.02 |
25.55 - 29.01 |
1.7954 times |
Tue 07 October 2025 |
30.36 (3.3%) |
29.54 |
29.39 - 31.66 |
0.5431 times |
Fri 03 October 2025 |
29.39 (-6.07%) |
31.46 |
28.51 - 31.68 |
1.5819 times |
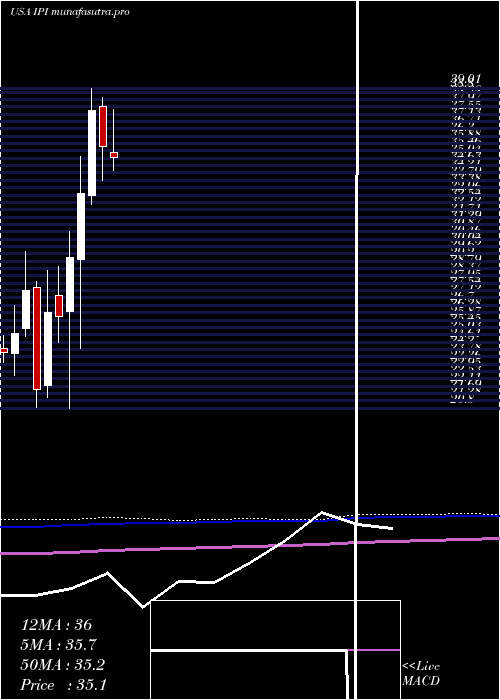
Monthly price and charts IntrepidPotash Strong monthly Stock price targets for IntrepidPotash IPI are 25.37 and 26.54 | Monthly Target 1 | 24.49 | | Monthly Target 2 | 25.08 | | Monthly Target 3 | 25.663333333333 | | Monthly Target 4 | 26.25 | | Monthly Target 5 | 26.83 |
Monthly price and volumes Intrepid Potash
| Date |
Closing |
Open |
Range |
Volume |
Thu 04 December 2025 |
25.66 (1.42%) |
25.20 |
25.08 - 26.25 |
0.1367 times |
Fri 28 November 2025 |
25.30 (-4.99%) |
25.89 |
22.55 - 27.33 |
0.8433 times |
Fri 31 October 2025 |
26.63 (-12.92%) |
30.23 |
25.55 - 31.66 |
1.0582 times |
Tue 30 September 2025 |
30.58 (0.49%) |
30.43 |
27.90 - 32.37 |
1.1081 times |
Fri 29 August 2025 |
30.43 (-8.56%) |
33.21 |
27.23 - 34.03 |
1.089 times |
Thu 31 July 2025 |
33.28 (-6.86%) |
35.40 |
32.31 - 37.84 |
0.8478 times |
Mon 30 June 2025 |
35.73 (-5.38%) |
38.01 |
33.77 - 38.48 |
0.9641 times |
Fri 30 May 2025 |
37.76 (14.29%) |
32.94 |
32.44 - 39.01 |
1.6115 times |
Wed 30 April 2025 |
33.04 (12.42%) |
29.29 |
24.26 - 35.17 |
1.1579 times |
Mon 31 March 2025 |
29.39 (12.65%) |
26.33 |
20.86 - 30.88 |
1.1834 times |
Fri 28 February 2025 |
26.09 (-0.76%) |
27.25 |
24.60 - 28.90 |
0.7465 times |
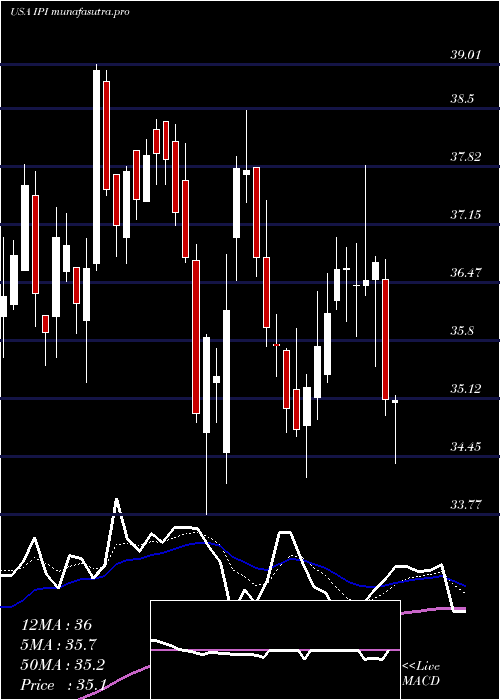
DMA SMA EMA moving averages of Intrepid Potash IPI
DMA (daily moving average) of Intrepid Potash IPI
| DMA period | DMA value | | 5 day DMA | 25.6 | | 12 day DMA | 25.12 | | 20 day DMA | 25.37 | | 35 day DMA | 26.15 | | 50 day DMA | 27.18 | | 100 day DMA | 29.06 | | 150 day DMA | 31.47 | | 200 day DMA | 30.53 | EMA (exponential moving average) of Intrepid Potash IPI
| EMA period | EMA current | EMA prev | EMA prev2 | | 5 day EMA | 25.56 | 25.51 | 25.36 | | 12 day EMA | 25.45 | 25.41 | 25.34 | | 20 day EMA | 25.65 | 25.65 | 25.63 | | 35 day EMA | 26.33 | 26.37 | 26.4 | | 50 day EMA | 27.14 | 27.2 | 27.26 |
SMA (simple moving average) of Intrepid Potash IPI
| SMA period | SMA current | SMA prev | SMA prev2 | | 5 day SMA | 25.6 | 25.46 | 25.31 | | 12 day SMA | 25.12 | 25.06 | 25.1 | | 20 day SMA | 25.37 | 25.39 | 25.39 | | 35 day SMA | 26.15 | 26.22 | 26.28 | | 50 day SMA | 27.18 | 27.23 | 27.28 | | 100 day SMA | 29.06 | 29.15 | 29.26 | | 150 day SMA | 31.47 | 31.52 | 31.57 | | 200 day SMA | 30.53 | 30.53 | 30.52 |
|
|
