InterpublicGroup IPG full analysis,charts,indicators,moving averages,SMA,DMA,EMA,ADX,MACD,RSIInterpublic Group IPG WideScreen charts, DMA,SMA,EMA technical analysis, forecast prediction, by indicators ADX,MACD,RSI,CCI USA stock exchange
operates under Technology sector & deals in Advertising
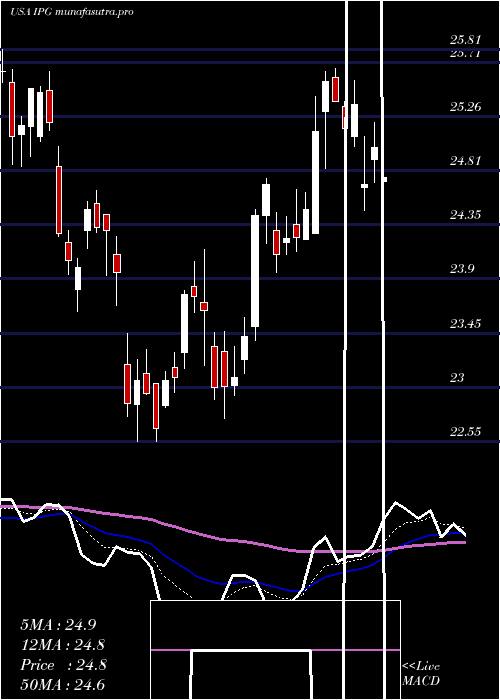
Daily price and charts and targets InterpublicGroup Strong Daily Stock price targets for InterpublicGroup IPG are 24.37 and 25.16 | Daily Target 1 | 24.21 | | Daily Target 2 | 24.53 | | Daily Target 3 | 25.003333333333 | | Daily Target 4 | 25.32 | | Daily Target 5 | 25.79 |
Daily price and volume Interpublic Group
| Date |
Closing |
Open |
Range |
Volume |
Wed 30 July 2025 |
24.84 (-2.24%) |
25.45 |
24.69 - 25.48 |
0.6757 times |
Tue 29 July 2025 |
25.41 (-0.43%) |
25.51 |
25.26 - 25.65 |
0.9286 times |
Mon 28 July 2025 |
25.52 (-2.03%) |
26.11 |
25.49 - 26.11 |
0.421 times |
Fri 25 July 2025 |
26.05 (-0.99%) |
26.39 |
25.81 - 26.39 |
0.5812 times |
Thu 24 July 2025 |
26.31 (-0.87%) |
26.38 |
26.23 - 27.03 |
1.0895 times |
Wed 23 July 2025 |
26.54 (3.31%) |
25.72 |
25.47 - 26.60 |
1.1663 times |
Tue 22 July 2025 |
25.69 (6.95%) |
24.44 |
24.44 - 25.79 |
1.4712 times |
Mon 21 July 2025 |
24.02 (-0.66%) |
24.27 |
24.00 - 24.34 |
0.8912 times |
Fri 18 July 2025 |
24.18 (0.21%) |
24.25 |
24.09 - 24.52 |
1.4888 times |
Thu 17 July 2025 |
24.13 (-4.25%) |
24.85 |
24.11 - 24.90 |
1.2864 times |
Wed 16 July 2025 |
25.20 (4.18%) |
24.43 |
24.38 - 25.21 |
1.4375 times |
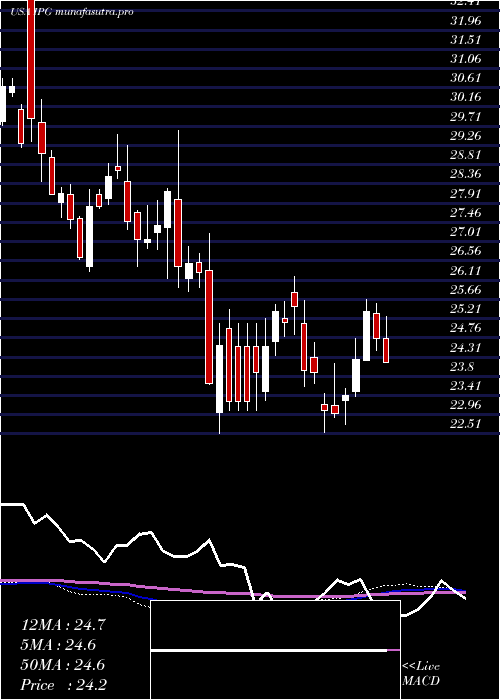
Weekly price and charts InterpublicGroup Strong weekly Stock price targets for InterpublicGroup IPG are 24.06 and 25.48 | Weekly Target 1 | 23.79 | | Weekly Target 2 | 24.32 | | Weekly Target 3 | 25.213333333333 | | Weekly Target 4 | 25.74 | | Weekly Target 5 | 26.63 |
Weekly price and volumes for Interpublic Group
| Date |
Closing |
Open |
Range |
Volume |
Wed 30 July 2025 |
24.84 (-4.64%) |
26.11 |
24.69 - 26.11 |
0.3715 times |
Fri 25 July 2025 |
26.05 (7.73%) |
24.27 |
24.00 - 27.03 |
0.9537 times |
Fri 18 July 2025 |
24.18 (-2.3%) |
24.75 |
24.09 - 25.25 |
1.1737 times |
Fri 11 July 2025 |
24.75 (-2.48%) |
25.34 |
24.47 - 25.56 |
0.8214 times |
Thu 03 July 2025 |
25.38 (4.66%) |
24.23 |
24.23 - 25.66 |
0.7641 times |
Fri 27 June 2025 |
24.25 (3.54%) |
23.51 |
23.39 - 24.74 |
1.5739 times |
Fri 20 June 2025 |
23.42 (1.83%) |
23.30 |
22.74 - 23.58 |
0.8017 times |
Fri 13 June 2025 |
23.00 (-0.26%) |
23.17 |
22.90 - 24.15 |
1.2178 times |
Fri 06 June 2025 |
23.06 (-3.76%) |
23.19 |
22.55 - 23.45 |
0.6964 times |
Fri 30 May 2025 |
23.96 (-0.17%) |
24.31 |
23.68 - 24.64 |
1.6257 times |
Fri 23 May 2025 |
24.00 (-5.85%) |
25.09 |
23.63 - 25.63 |
0.4433 times |
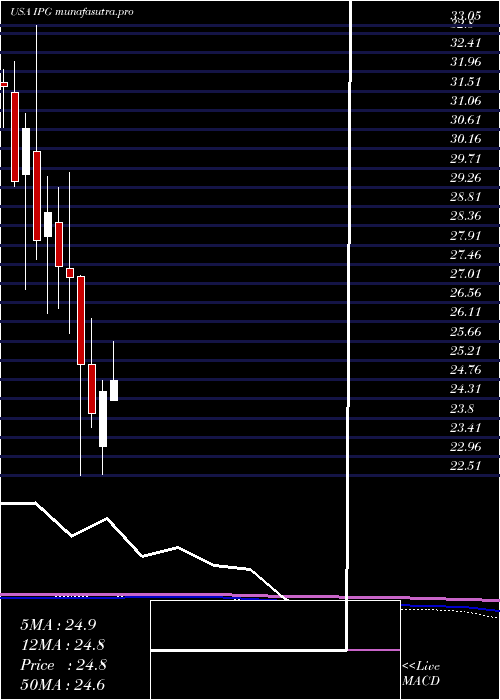
Monthly price and charts InterpublicGroup Strong monthly Stock price targets for InterpublicGroup IPG are 24.42 and 27.45 | Monthly Target 1 | 22.26 | | Monthly Target 2 | 23.55 | | Monthly Target 3 | 25.29 | | Monthly Target 4 | 26.58 | | Monthly Target 5 | 28.32 |
Monthly price and volumes Interpublic Group
| Date |
Closing |
Open |
Range |
Volume |
Wed 30 July 2025 |
24.84 (1.47%) |
24.28 |
24.00 - 27.03 |
1.2115 times |
Mon 30 June 2025 |
24.48 (2.17%) |
23.19 |
22.55 - 24.74 |
1.3803 times |
Fri 30 May 2025 |
23.96 (-4.62%) |
25.12 |
23.63 - 26.20 |
0.9888 times |
Wed 30 April 2025 |
25.12 (-7.51%) |
27.17 |
22.51 - 27.19 |
0.8206 times |
Mon 31 March 2025 |
27.16 (-0.88%) |
27.35 |
25.85 - 29.62 |
1.5049 times |
Fri 28 February 2025 |
27.40 (-4.43%) |
28.43 |
26.43 - 29.25 |
0.897 times |
Fri 31 January 2025 |
28.67 (2.32%) |
28.10 |
26.30 - 29.52 |
0.7601 times |
Tue 31 December 2024 |
28.02 (-8.52%) |
30.11 |
27.58 - 33.05 |
0.9944 times |
Tue 26 November 2024 |
30.63 (4.18%) |
29.56 |
26.88 - 31.00 |
0.7388 times |
Thu 31 October 2024 |
29.40 (-7.05%) |
31.49 |
29.28 - 32.21 |
0.7035 times |
Mon 30 September 2024 |
31.63 (-3.01%) |
32.07 |
29.28 - 32.26 |
0.6312 times |
DMA SMA EMA moving averages of Interpublic Group IPG
DMA (daily moving average) of Interpublic Group IPG
| DMA period | DMA value | | 5 day DMA | 25.63 | | 12 day DMA | 25.17 | | 20 day DMA | 25.14 | | 35 day DMA | 24.59 | | 50 day DMA | 24.42 | | 100 day DMA | 24.86 | | 150 day DMA | 25.84 | | 200 day DMA | 26.86 | EMA (exponential moving average) of Interpublic Group IPG
| EMA period | EMA current | EMA prev | EMA prev2 | | 5 day EMA | 25.35 | 25.61 | 25.71 | | 12 day EMA | 25.27 | 25.35 | 25.34 | | 20 day EMA | 25.09 | 25.12 | 25.09 | | 35 day EMA | 24.85 | 24.85 | 24.82 | | 50 day EMA | 24.61 | 24.6 | 24.57 |
SMA (simple moving average) of Interpublic Group IPG
| SMA period | SMA current | SMA prev | SMA prev2 | | 5 day SMA | 25.63 | 25.97 | 26.02 | | 12 day SMA | 25.17 | 25.16 | 25.11 | | 20 day SMA | 25.14 | 25.15 | 25.1 | | 35 day SMA | 24.59 | 24.54 | 24.46 | | 50 day SMA | 24.42 | 24.43 | 24.42 | | 100 day SMA | 24.86 | 24.88 | 24.9 | | 150 day SMA | 25.84 | 25.87 | 25.89 | | 200 day SMA | 26.86 | 26.89 | 26.92 |
|
|
