InterParfums IPAR full analysis,charts,indicators,moving averages,SMA,DMA,EMA,ADX,MACD,RSIInter Parfums IPAR WideScreen charts, DMA,SMA,EMA technical analysis, forecast prediction, by indicators ADX,MACD,RSI,CCI USA stock exchange
operates under Consumer Non Durables sector & deals in Package Goods Cosmetics
Daily price and charts and targets InterParfums Strong Daily Stock price targets for InterParfums IPAR are 82.08 and 84.28 | Daily Target 1 | 80.39 | | Daily Target 2 | 81.57 | | Daily Target 3 | 82.59 | | Daily Target 4 | 83.77 | | Daily Target 5 | 84.79 |
Daily price and volume Inter Parfums
| Date |
Closing |
Open |
Range |
Volume |
Fri 05 December 2025 |
82.75 (0.75%) |
81.74 |
81.41 - 83.61 |
0.7203 times |
Thu 04 December 2025 |
82.13 (0.11%) |
82.55 |
81.60 - 83.10 |
0.5655 times |
Wed 03 December 2025 |
82.04 (1.6%) |
80.75 |
80.75 - 82.38 |
1.1512 times |
Tue 02 December 2025 |
80.75 (-0.1%) |
81.77 |
79.50 - 82.07 |
1.0247 times |
Mon 01 December 2025 |
80.83 (-0.54%) |
80.67 |
80.08 - 82.10 |
0.8843 times |
Fri 28 November 2025 |
81.27 (0.43%) |
80.86 |
80.51 - 81.47 |
0.5057 times |
Wed 26 November 2025 |
80.92 (0.76%) |
80.10 |
80.07 - 81.63 |
1.1877 times |
Tue 25 November 2025 |
80.31 (0.93%) |
80.38 |
79.75 - 82.36 |
1.2697 times |
Mon 24 November 2025 |
79.57 (-1.29%) |
81.00 |
79.37 - 81.32 |
1.1672 times |
Fri 21 November 2025 |
80.61 (-0.49%) |
82.38 |
79.91 - 83.98 |
1.5236 times |
Thu 20 November 2025 |
81.01 (0.92%) |
80.94 |
78.52 - 82.19 |
1.458 times |
Weekly price and charts InterParfums Strong weekly Stock price targets for InterParfums IPAR are 81.13 and 85.24 | Weekly Target 1 | 77.84 | | Weekly Target 2 | 80.3 | | Weekly Target 3 | 81.953333333333 | | Weekly Target 4 | 84.41 | | Weekly Target 5 | 86.06 |
Weekly price and volumes for Inter Parfums
| Date |
Closing |
Open |
Range |
Volume |
Fri 05 December 2025 |
82.75 (1.82%) |
80.67 |
79.50 - 83.61 |
1.1128 times |
Fri 28 November 2025 |
81.27 (0.82%) |
81.00 |
79.37 - 82.36 |
1.0575 times |
Fri 21 November 2025 |
80.61 (-7.8%) |
87.30 |
77.21 - 87.44 |
1.7924 times |
Fri 14 November 2025 |
87.43 (0.06%) |
87.50 |
86.09 - 90.12 |
0.9516 times |
Fri 07 November 2025 |
87.38 (-1.99%) |
90.27 |
86.50 - 92.31 |
0.7677 times |
Fri 31 October 2025 |
89.15 (0%) |
88.87 |
87.64 - 89.63 |
0.204 times |
Fri 31 October 2025 |
89.15 (-7.61%) |
96.69 |
87.64 - 96.97 |
0.982 times |
Fri 24 October 2025 |
96.49 (-1.91%) |
98.69 |
95.97 - 100.73 |
0.9547 times |
Fri 17 October 2025 |
98.37 (6.39%) |
92.80 |
91.06 - 98.89 |
1.2168 times |
Fri 10 October 2025 |
92.46 (-2.16%) |
94.44 |
91.19 - 95.69 |
0.9604 times |
Fri 03 October 2025 |
94.50 (-6.65%) |
101.37 |
92.46 - 101.51 |
1.1773 times |
Monthly price and charts InterParfums Strong monthly Stock price targets for InterParfums IPAR are 81.13 and 85.24 | Monthly Target 1 | 77.84 | | Monthly Target 2 | 80.3 | | Monthly Target 3 | 81.953333333333 | | Monthly Target 4 | 84.41 | | Monthly Target 5 | 86.06 |
Monthly price and volumes Inter Parfums
| Date |
Closing |
Open |
Range |
Volume |
Fri 05 December 2025 |
82.75 (1.82%) |
80.67 |
79.50 - 83.61 |
0.2508 times |
Fri 28 November 2025 |
81.27 (-8.84%) |
90.27 |
77.21 - 92.31 |
1.03 times |
Fri 31 October 2025 |
89.15 (-9.38%) |
98.23 |
87.64 - 100.73 |
1.1283 times |
Tue 30 September 2025 |
98.38 (-14.41%) |
114.07 |
98.00 - 116.11 |
1.2171 times |
Fri 29 August 2025 |
114.94 (-4.69%) |
119.57 |
110.75 - 122.66 |
0.9978 times |
Thu 31 July 2025 |
120.60 (-8.16%) |
130.76 |
117.92 - 139.94 |
0.9422 times |
Mon 30 June 2025 |
131.31 (-3.6%) |
136.01 |
130.26 - 142.61 |
0.708 times |
Fri 30 May 2025 |
136.22 (24.74%) |
111.50 |
108.46 - 136.77 |
1.0999 times |
Wed 30 April 2025 |
109.20 (-4.1%) |
114.33 |
97.65 - 115.79 |
1.2637 times |
Mon 31 March 2025 |
113.87 (-18.03%) |
143.00 |
113.08 - 146.00 |
1.3621 times |
Fri 28 February 2025 |
138.92 (-1.49%) |
138.23 |
132.21 - 148.15 |
0.6341 times |

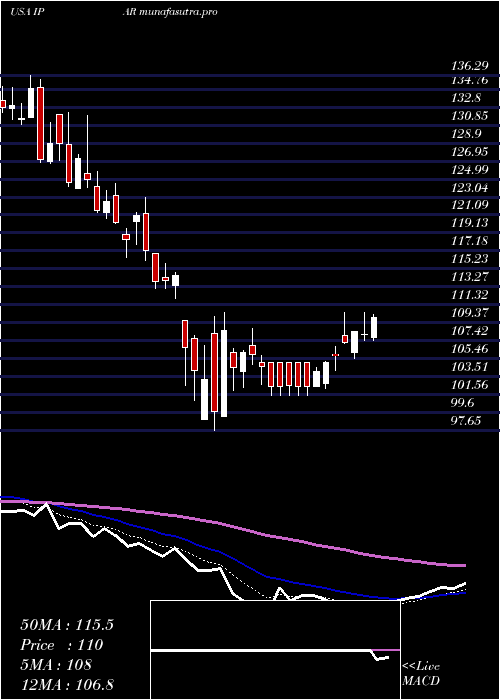
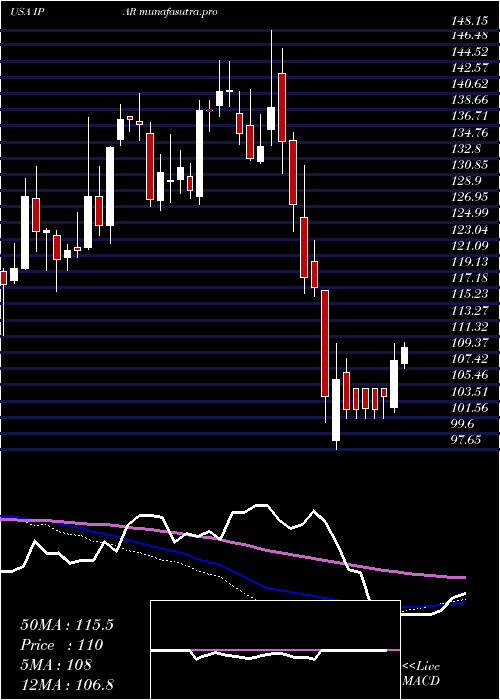
DMA SMA EMA moving averages of Inter Parfums IPAR
DMA (daily moving average) of Inter Parfums IPAR
| DMA period | DMA value | | 5 day DMA | 81.7 | | 12 day DMA | 81.04 | | 20 day DMA | 83.38 | | 35 day DMA | 87.93 | | 50 day DMA | 90.12 | | 100 day DMA | 102.53 | | 150 day DMA | 112.22 | | 200 day DMA | 113.59 | EMA (exponential moving average) of Inter Parfums IPAR
| EMA period | EMA current | EMA prev | EMA prev2 | | 5 day EMA | 81.96 | 81.57 | 81.29 | | 12 day EMA | 82.32 | 82.24 | 82.26 | | 20 day EMA | 83.8 | 83.91 | 84.1 | | 35 day EMA | 86.79 | 87.03 | 87.32 | | 50 day EMA | 90.19 | 90.49 | 90.83 |
SMA (simple moving average) of Inter Parfums IPAR
| SMA period | SMA current | SMA prev | SMA prev2 | | 5 day SMA | 81.7 | 81.4 | 81.16 | | 12 day SMA | 81.04 | 81.29 | 81.43 | | 20 day SMA | 83.38 | 83.63 | 84.09 | | 35 day SMA | 87.93 | 88.31 | 88.68 | | 50 day SMA | 90.12 | 90.47 | 90.84 | | 100 day SMA | 102.53 | 103.03 | 103.52 | | 150 day SMA | 112.22 | 112.39 | 112.57 | | 200 day SMA | 113.59 | 113.84 | 114.11 |
|
|
