IovanceBiotherapeutics IOVA full analysis,charts,indicators,moving averages,SMA,DMA,EMA,ADX,MACD,RSIIovance Biotherapeutics IOVA WideScreen charts, DMA,SMA,EMA technical analysis, forecast prediction, by indicators ADX,MACD,RSI,CCI USA stock exchange
operates under Health Care sector & deals in Biotechnology Biological Products No Diagnostic Substances
Daily price and charts and targets IovanceBiotherapeutics Strong Daily Stock price targets for IovanceBiotherapeutics IOVA are 2.25 and 2.47 | Daily Target 1 | 2.08 | | Daily Target 2 | 2.2 | | Daily Target 3 | 2.3033333333333 | | Daily Target 4 | 2.42 | | Daily Target 5 | 2.52 |
Daily price and volume Iovance Biotherapeutics
| Date |
Closing |
Open |
Range |
Volume |
Mon 20 October 2025 |
2.31 (5%) |
2.20 |
2.19 - 2.41 |
1.5677 times |
Fri 17 October 2025 |
2.20 (-0.9%) |
2.21 |
2.13 - 2.24 |
0.6785 times |
Thu 16 October 2025 |
2.22 (-0.89%) |
2.25 |
2.20 - 2.31 |
0.8956 times |
Wed 15 October 2025 |
2.24 (5.66%) |
2.14 |
2.12 - 2.27 |
1.1535 times |
Tue 14 October 2025 |
2.12 (-0.93%) |
2.09 |
2.09 - 2.19 |
0.8377 times |
Mon 13 October 2025 |
2.14 (1.9%) |
2.14 |
2.09 - 2.16 |
0.6545 times |
Fri 10 October 2025 |
2.10 (-4.11%) |
2.19 |
2.04 - 2.19 |
1.1487 times |
Thu 09 October 2025 |
2.19 (-3.52%) |
2.27 |
2.18 - 2.28 |
0.8836 times |
Wed 08 October 2025 |
2.27 (4.13%) |
2.20 |
2.18 - 2.34 |
1.2217 times |
Tue 07 October 2025 |
2.18 (-0.91%) |
2.21 |
2.09 - 2.23 |
0.9586 times |
Mon 06 October 2025 |
2.20 (-6.38%) |
2.33 |
2.20 - 2.40 |
1.2174 times |
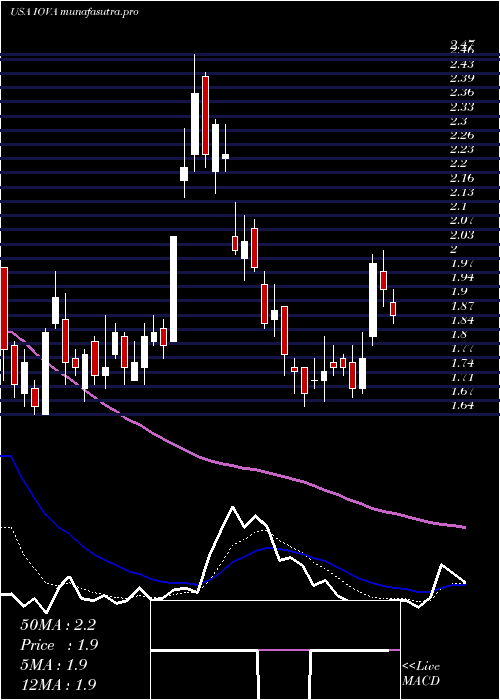
Weekly price and charts IovanceBiotherapeutics Strong weekly Stock price targets for IovanceBiotherapeutics IOVA are 2.25 and 2.47 | Weekly Target 1 | 2.08 | | Weekly Target 2 | 2.2 | | Weekly Target 3 | 2.3033333333333 | | Weekly Target 4 | 2.42 | | Weekly Target 5 | 2.52 |
Weekly price and volumes for Iovance Biotherapeutics
| Date |
Closing |
Open |
Range |
Volume |
Mon 20 October 2025 |
2.31 (5%) |
2.20 |
2.19 - 2.41 |
0.4594 times |
Fri 17 October 2025 |
2.20 (4.76%) |
2.14 |
2.09 - 2.31 |
1.2365 times |
Fri 10 October 2025 |
2.10 (-10.64%) |
2.33 |
2.04 - 2.40 |
1.5911 times |
Fri 03 October 2025 |
2.35 (11.37%) |
2.14 |
2.08 - 2.35 |
0.9338 times |
Fri 26 September 2025 |
2.11 (2.93%) |
2.08 |
1.97 - 2.17 |
1.029 times |
Fri 19 September 2025 |
2.05 (-9.69%) |
2.30 |
2.05 - 2.38 |
1.3894 times |
Fri 12 September 2025 |
2.27 (-8.84%) |
2.48 |
2.27 - 2.48 |
1.1497 times |
Fri 05 September 2025 |
2.49 (11.66%) |
2.20 |
2.11 - 2.50 |
0.9136 times |
Fri 29 August 2025 |
2.23 (0%) |
2.23 |
2.18 - 2.26 |
0.1661 times |
Fri 29 August 2025 |
2.23 (-17.1%) |
2.57 |
2.18 - 2.66 |
1.1313 times |
Fri 22 August 2025 |
2.69 (5.49%) |
2.55 |
2.43 - 2.85 |
1.8246 times |
Monthly price and charts IovanceBiotherapeutics Strong monthly Stock price targets for IovanceBiotherapeutics IOVA are 2.18 and 2.55 | Monthly Target 1 | 1.88 | | Monthly Target 2 | 2.1 | | Monthly Target 3 | 2.2533333333333 | | Monthly Target 4 | 2.47 | | Monthly Target 5 | 2.62 |
Monthly price and volumes Iovance Biotherapeutics
| Date |
Closing |
Open |
Range |
Volume |
Mon 20 October 2025 |
2.31 (6.45%) |
2.16 |
2.04 - 2.41 |
0.6278 times |
Tue 30 September 2025 |
2.17 (-2.69%) |
2.20 |
1.97 - 2.50 |
0.7948 times |
Fri 29 August 2025 |
2.23 (-13.23%) |
2.50 |
1.90 - 2.85 |
1.1884 times |
Thu 31 July 2025 |
2.57 (49.42%) |
1.72 |
1.67 - 4.33 |
2.0179 times |
Mon 30 June 2025 |
1.72 (-1.71%) |
1.72 |
1.66 - 2.47 |
0.869 times |
Fri 30 May 2025 |
1.75 (-51.25%) |
3.60 |
1.64 - 3.73 |
1.5609 times |
Wed 30 April 2025 |
3.59 (7.81%) |
3.32 |
2.70 - 3.66 |
0.7563 times |
Mon 31 March 2025 |
3.33 (-21.46%) |
4.27 |
3.19 - 4.57 |
0.6751 times |
Fri 28 February 2025 |
4.24 (-27.52%) |
5.59 |
3.62 - 6.16 |
0.7399 times |
Fri 31 January 2025 |
5.85 (-20.95%) |
7.54 |
5.57 - 8.15 |
0.7701 times |
Tue 31 December 2024 |
7.40 (-18.86%) |
9.13 |
7.05 - 9.30 |
0.3783 times |
DMA SMA EMA moving averages of Iovance Biotherapeutics IOVA
DMA (daily moving average) of Iovance Biotherapeutics IOVA
| DMA period | DMA value | | 5 day DMA | 2.22 | | 12 day DMA | 2.21 | | 20 day DMA | 2.19 | | 35 day DMA | 2.22 | | 50 day DMA | 2.29 | | 100 day DMA | 2.24 | | 150 day DMA | 2.48 | | 200 day DMA | 3.23 | EMA (exponential moving average) of Iovance Biotherapeutics IOVA
| EMA period | EMA current | EMA prev | EMA prev2 | | 5 day EMA | 2.23 | 2.19 | 2.19 | | 12 day EMA | 2.21 | 2.19 | 2.19 | | 20 day EMA | 2.21 | 2.2 | 2.2 | | 35 day EMA | 2.24 | 2.24 | 2.24 | | 50 day EMA | 2.3 | 2.3 | 2.3 |
SMA (simple moving average) of Iovance Biotherapeutics IOVA
| SMA period | SMA current | SMA prev | SMA prev2 | | 5 day SMA | 2.22 | 2.18 | 2.16 | | 12 day SMA | 2.21 | 2.21 | 2.21 | | 20 day SMA | 2.19 | 2.18 | 2.17 | | 35 day SMA | 2.22 | 2.22 | 2.22 | | 50 day SMA | 2.29 | 2.28 | 2.28 | | 100 day SMA | 2.24 | 2.24 | 2.23 | | 150 day SMA | 2.48 | 2.48 | 2.49 | | 200 day SMA | 3.23 | 3.26 | 3.29 |
|
|
