IntergroupCorporation INTG full analysis,charts,indicators,moving averages,SMA,DMA,EMA,ADX,MACD,RSIIntergroup Corporation INTG WideScreen charts, DMA,SMA,EMA technical analysis, forecast prediction, by indicators ADX,MACD,RSI,CCI USA stock exchange
operates under Consumer Services sector & deals in Building Operators
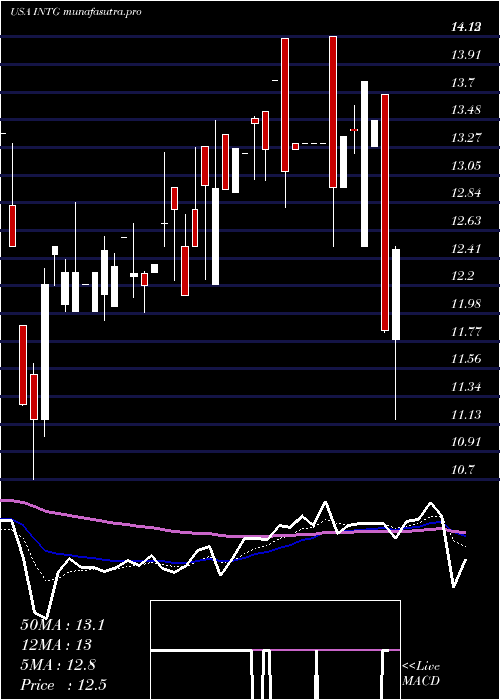
Daily price and charts and targets IntergroupCorporation Strong Daily Stock price targets for IntergroupCorporation INTG are 28.21 and 32.59 | Daily Target 1 | 24.93 | | Daily Target 2 | 27.11 | | Daily Target 3 | 29.306666666667 | | Daily Target 4 | 31.49 | | Daily Target 5 | 33.69 |
Daily price and volume Intergroup Corporation
| Date |
Closing |
Open |
Range |
Volume |
Mon 20 October 2025 |
29.30 (0.86%) |
28.12 |
27.12 - 31.50 |
1.4529 times |
Fri 17 October 2025 |
29.05 (-7.81%) |
28.64 |
26.02 - 32.08 |
1.9724 times |
Thu 16 October 2025 |
31.51 (9.6%) |
28.20 |
19.79 - 32.20 |
1.9562 times |
Wed 15 October 2025 |
28.75 (6.36%) |
27.42 |
27.42 - 40.99 |
2.5487 times |
Tue 14 October 2025 |
27.03 (12.63%) |
24.30 |
23.90 - 27.33 |
0.8036 times |
Mon 13 October 2025 |
24.00 (1.05%) |
24.50 |
24.00 - 25.00 |
0.2435 times |
Fri 10 October 2025 |
23.75 (16.94%) |
24.11 |
21.00 - 24.11 |
0.5438 times |
Thu 09 October 2025 |
20.31 (1.55%) |
20.31 |
20.31 - 21.00 |
0.0893 times |
Wed 08 October 2025 |
20.00 (0.1%) |
19.61 |
19.29 - 20.03 |
0.1299 times |
Fri 03 October 2025 |
19.98 (1.68%) |
18.84 |
18.84 - 20.66 |
0.2597 times |
Thu 02 October 2025 |
19.65 (-2.53%) |
19.44 |
19.26 - 20.43 |
0.3393 times |
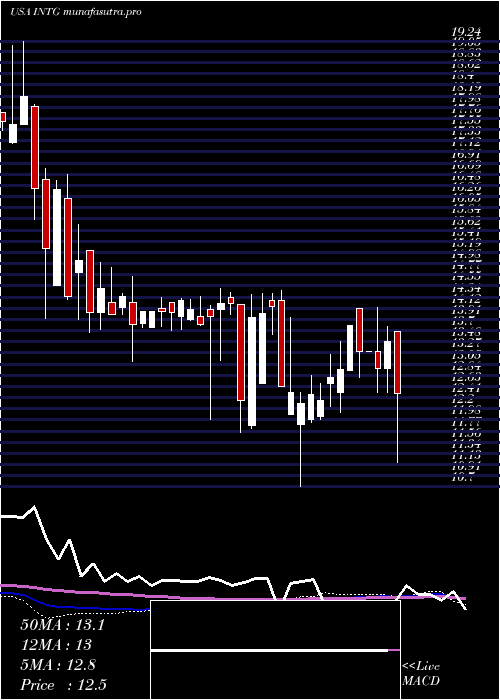
Weekly price and charts IntergroupCorporation Strong weekly Stock price targets for IntergroupCorporation INTG are 28.21 and 32.59 | Weekly Target 1 | 24.93 | | Weekly Target 2 | 27.11 | | Weekly Target 3 | 29.306666666667 | | Weekly Target 4 | 31.49 | | Weekly Target 5 | 33.69 |
Weekly price and volumes for Intergroup Corporation
| Date |
Closing |
Open |
Range |
Volume |
Mon 20 October 2025 |
29.30 (0.86%) |
28.12 |
27.12 - 31.50 |
0.7879 times |
Fri 17 October 2025 |
29.05 (22.32%) |
24.50 |
19.79 - 40.99 |
4.0805 times |
Fri 10 October 2025 |
23.75 (18.87%) |
19.61 |
19.29 - 24.11 |
0.4138 times |
Fri 03 October 2025 |
19.98 (8.47%) |
18.42 |
16.88 - 20.66 |
0.8399 times |
Fri 26 September 2025 |
18.42 (-2.54%) |
19.44 |
17.45 - 19.44 |
0.8892 times |
Fri 19 September 2025 |
18.90 (-5.22%) |
19.88 |
18.05 - 20.50 |
0.7615 times |
Fri 12 September 2025 |
19.94 (14.47%) |
18.22 |
18.03 - 20.87 |
0.4006 times |
Fri 05 September 2025 |
17.42 (4.88%) |
17.00 |
16.42 - 18.76 |
0.3477 times |
Fri 29 August 2025 |
16.61 (0%) |
15.90 |
15.90 - 16.78 |
0.3962 times |
Fri 29 August 2025 |
16.61 (19.67%) |
13.32 |
13.31 - 16.78 |
1.0828 times |
Fri 22 August 2025 |
13.88 (10.86%) |
12.27 |
12.25 - 14.42 |
0.7351 times |
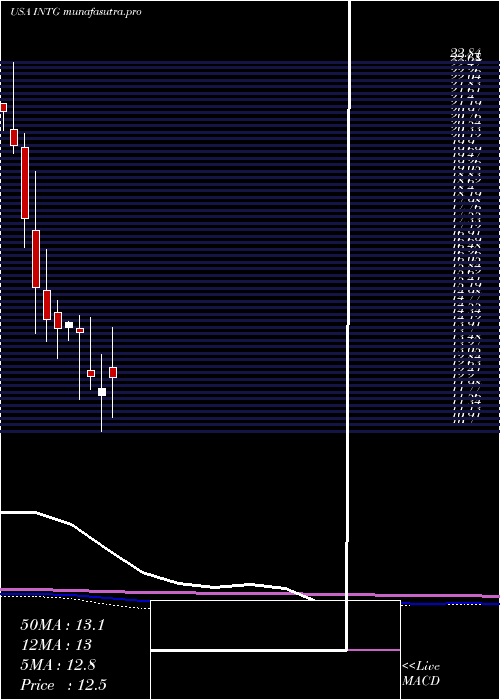
Monthly price and charts IntergroupCorporation Strong monthly Stock price targets for IntergroupCorporation INTG are 24.07 and 46.22 | Monthly Target 1 | 7.56 | | Monthly Target 2 | 18.43 | | Monthly Target 3 | 29.71 | | Monthly Target 4 | 40.58 | | Monthly Target 5 | 51.86 |
Monthly price and volumes Intergroup Corporation
| Date |
Closing |
Open |
Range |
Volume |
Mon 20 October 2025 |
29.30 (45.34%) |
19.44 |
18.84 - 40.99 |
1.7419 times |
Tue 30 September 2025 |
20.16 (21.37%) |
17.00 |
16.42 - 20.87 |
0.9053 times |
Fri 29 August 2025 |
16.61 (41.36%) |
11.70 |
10.81 - 16.78 |
1.2376 times |
Thu 31 July 2025 |
11.75 (1.73%) |
11.87 |
9.57 - 14.00 |
0.8277 times |
Mon 30 June 2025 |
11.55 (-1.28%) |
12.23 |
10.18 - 15.96 |
1.8352 times |
Fri 30 May 2025 |
11.70 (-8.59%) |
14.00 |
11.45 - 14.00 |
0.3706 times |
Wed 30 April 2025 |
12.80 (5.61%) |
12.79 |
11.16 - 14.13 |
0.7294 times |
Mon 31 March 2025 |
12.12 (-3.04%) |
11.89 |
10.70 - 13.23 |
0.6801 times |
Fri 28 February 2025 |
12.50 (-10.39%) |
12.69 |
12.08 - 14.46 |
0.3419 times |
Fri 31 January 2025 |
13.95 (-2.24%) |
14.07 |
11.75 - 14.50 |
1.3304 times |
Tue 31 December 2024 |
14.27 (1.42%) |
14.11 |
13.70 - 14.33 |
0.3895 times |
DMA SMA EMA moving averages of Intergroup Corporation INTG
DMA (daily moving average) of Intergroup Corporation INTG
| DMA period | DMA value | | 5 day DMA | 29.13 | | 12 day DMA | 24.46 | | 20 day DMA | 22.07 | | 35 day DMA | 20.35 | | 50 day DMA | 18.1 | | 100 day DMA | 15.03 | | 150 day DMA | 14.31 | | 200 day DMA | 14.22 | EMA (exponential moving average) of Intergroup Corporation INTG
| EMA period | EMA current | EMA prev | EMA prev2 | | 5 day EMA | 28.42 | 27.98 | 27.45 | | 12 day EMA | 25.53 | 24.84 | 24.07 | | 20 day EMA | 23.44 | 22.82 | 22.16 | | 35 day EMA | 20.68 | 20.17 | 19.65 | | 50 day EMA | 18.64 | 18.21 | 17.77 |
SMA (simple moving average) of Intergroup Corporation INTG
| SMA period | SMA current | SMA prev | SMA prev2 | | 5 day SMA | 29.13 | 28.07 | 27.01 | | 12 day SMA | 24.46 | 23.58 | 22.69 | | 20 day SMA | 22.07 | 21.57 | 21.1 | | 35 day SMA | 20.35 | 19.93 | 19.5 | | 50 day SMA | 18.1 | 17.74 | 17.39 | | 100 day SMA | 15.03 | 14.86 | 14.69 | | 150 day SMA | 14.31 | 14.21 | 14.11 | | 200 day SMA | 14.22 | 14.14 | 14.07 |
|
|
