InovioPharmaceuticals INO full analysis,charts,indicators,moving averages,SMA,DMA,EMA,ADX,MACD,RSIInovio Pharmaceuticals INO WideScreen charts, DMA,SMA,EMA technical analysis, forecast prediction, by indicators ADX,MACD,RSI,CCI USA stock exchange
operates under Health Care sector & deals in Medical Dental Instruments
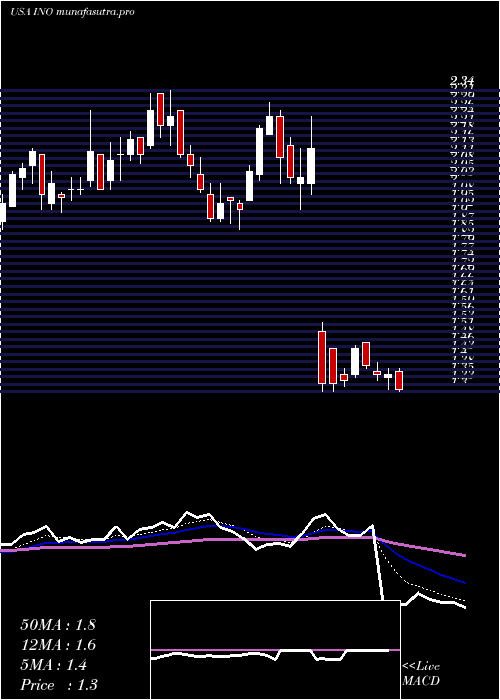
Daily price and charts and targets InovioPharmaceuticals Strong Daily Stock price targets for InovioPharmaceuticals INO are 2 and 2.1 | Daily Target 1 | 1.92 | | Daily Target 2 | 1.97 | | Daily Target 3 | 2.0166666666667 | | Daily Target 4 | 2.07 | | Daily Target 5 | 2.12 |
Daily price and volume Inovio Pharmaceuticals
| Date |
Closing |
Open |
Range |
Volume |
Thu 04 December 2025 |
2.03 (0.5%) |
2.01 |
1.96 - 2.06 |
0.7084 times |
Wed 03 December 2025 |
2.02 (5.21%) |
1.91 |
1.90 - 2.04 |
0.8963 times |
Tue 02 December 2025 |
1.92 (0%) |
1.93 |
1.86 - 1.93 |
1.6179 times |
Mon 01 December 2025 |
1.92 (-6.8%) |
2.06 |
1.90 - 2.10 |
1.1844 times |
Fri 28 November 2025 |
2.06 (5.1%) |
2.00 |
1.97 - 2.07 |
0.6644 times |
Wed 26 November 2025 |
1.96 (7.69%) |
1.82 |
1.82 - 1.99 |
1.4892 times |
Tue 25 November 2025 |
1.82 (0.55%) |
1.87 |
1.76 - 1.87 |
0.6248 times |
Mon 24 November 2025 |
1.81 (2.84%) |
1.79 |
1.78 - 1.85 |
1.0422 times |
Fri 21 November 2025 |
1.76 (1.73%) |
1.73 |
1.72 - 1.79 |
0.8434 times |
Thu 20 November 2025 |
1.73 (-2.81%) |
1.85 |
1.72 - 1.88 |
0.929 times |
Wed 19 November 2025 |
1.78 (-5.82%) |
1.90 |
1.77 - 1.91 |
1.7588 times |
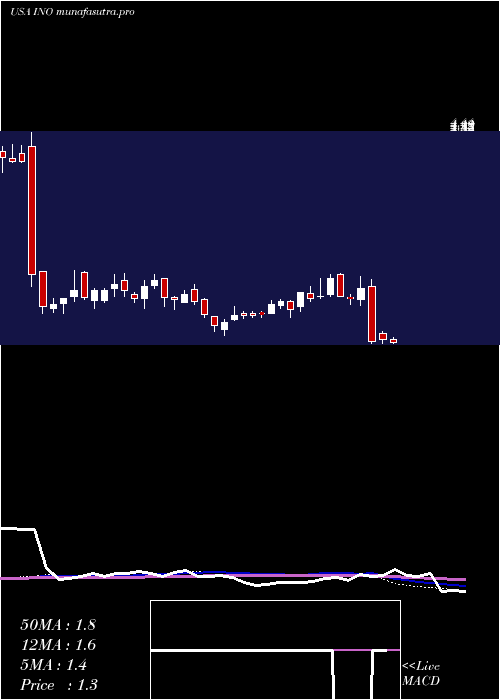
Weekly price and charts InovioPharmaceuticals Strong weekly Stock price targets for InovioPharmaceuticals INO are 1.83 and 2.07 | Weekly Target 1 | 1.76 | | Weekly Target 2 | 1.89 | | Weekly Target 3 | 1.9966666666667 | | Weekly Target 4 | 2.13 | | Weekly Target 5 | 2.24 |
Weekly price and volumes for Inovio Pharmaceuticals
| Date |
Closing |
Open |
Range |
Volume |
Thu 04 December 2025 |
2.03 (-1.46%) |
2.06 |
1.86 - 2.10 |
0.8093 times |
Fri 28 November 2025 |
2.06 (17.05%) |
1.79 |
1.76 - 2.07 |
0.7016 times |
Fri 21 November 2025 |
1.76 (-14.15%) |
2.08 |
1.72 - 2.11 |
1.1515 times |
Fri 14 November 2025 |
2.05 (-3.76%) |
2.17 |
1.90 - 2.23 |
1.6026 times |
Fri 07 November 2025 |
2.13 (-9.36%) |
2.43 |
2.03 - 2.58 |
1.3255 times |
Fri 31 October 2025 |
2.35 (0%) |
2.40 |
2.31 - 2.42 |
0.1114 times |
Fri 31 October 2025 |
2.35 (0.86%) |
2.56 |
2.31 - 2.68 |
1.2945 times |
Fri 24 October 2025 |
2.33 (-4.12%) |
2.41 |
2.21 - 2.49 |
0.9182 times |
Fri 17 October 2025 |
2.43 (-5.45%) |
2.59 |
2.35 - 2.63 |
0.7895 times |
Fri 10 October 2025 |
2.57 (5.76%) |
2.42 |
2.28 - 2.68 |
1.2959 times |
Fri 03 October 2025 |
2.43 (-2.02%) |
2.50 |
2.28 - 2.54 |
0.7831 times |
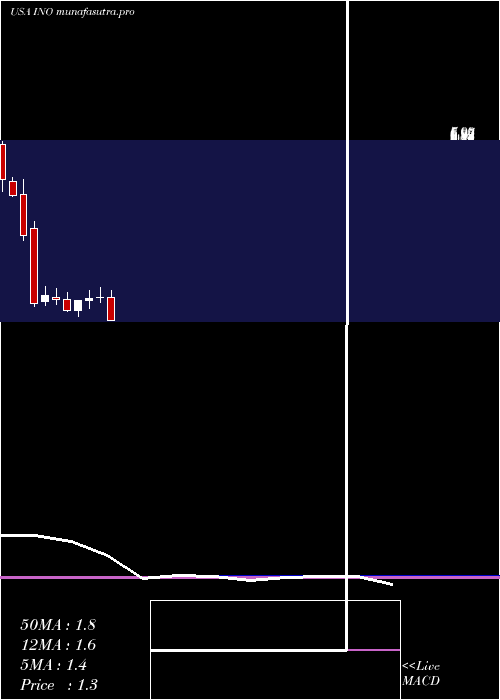
Monthly price and charts InovioPharmaceuticals Strong monthly Stock price targets for InovioPharmaceuticals INO are 1.83 and 2.07 | Monthly Target 1 | 1.76 | | Monthly Target 2 | 1.89 | | Monthly Target 3 | 1.9966666666667 | | Monthly Target 4 | 2.13 | | Monthly Target 5 | 2.24 |
Monthly price and volumes Inovio Pharmaceuticals
| Date |
Closing |
Open |
Range |
Volume |
Thu 04 December 2025 |
2.03 (-1.46%) |
2.06 |
1.86 - 2.10 |
0.156 times |
Fri 28 November 2025 |
2.06 (-12.34%) |
2.43 |
1.72 - 2.58 |
0.9216 times |
Fri 31 October 2025 |
2.35 (0.43%) |
2.34 |
2.21 - 2.68 |
0.9401 times |
Tue 30 September 2025 |
2.34 (-1.27%) |
2.35 |
2.16 - 2.98 |
1.234 times |
Fri 29 August 2025 |
2.37 (66.9%) |
1.39 |
1.35 - 2.51 |
1.8536 times |
Thu 31 July 2025 |
1.42 (-30.39%) |
2.02 |
1.30 - 2.25 |
2.7326 times |
Mon 30 June 2025 |
2.04 (2%) |
2.03 |
1.86 - 2.34 |
0.7116 times |
Fri 30 May 2025 |
2.00 (3.09%) |
1.94 |
1.69 - 2.27 |
0.4703 times |
Wed 30 April 2025 |
1.94 (19.02%) |
1.63 |
1.42 - 1.95 |
0.4831 times |
Mon 31 March 2025 |
1.63 (-17.68%) |
1.98 |
1.60 - 2.18 |
0.497 times |
Fri 28 February 2025 |
1.98 (-5.26%) |
2.03 |
1.82 - 2.33 |
0.535 times |
DMA SMA EMA moving averages of Inovio Pharmaceuticals INO
DMA (daily moving average) of Inovio Pharmaceuticals INO
| DMA period | DMA value | | 5 day DMA | 1.99 | | 12 day DMA | 1.89 | | 20 day DMA | 1.96 | | 35 day DMA | 2.14 | | 50 day DMA | 2.24 | | 100 day DMA | 2.11 | | 150 day DMA | 2.04 | | 200 day DMA | 2 | EMA (exponential moving average) of Inovio Pharmaceuticals INO
| EMA period | EMA current | EMA prev | EMA prev2 | | 5 day EMA | 1.98 | 1.96 | 1.93 | | 12 day EMA | 1.96 | 1.95 | 1.94 | | 20 day EMA | 2 | 2 | 2 | | 35 day EMA | 2.1 | 2.1 | 2.11 | | 50 day EMA | 2.23 | 2.24 | 2.25 |
SMA (simple moving average) of Inovio Pharmaceuticals INO
| SMA period | SMA current | SMA prev | SMA prev2 | | 5 day SMA | 1.99 | 1.98 | 1.94 | | 12 day SMA | 1.89 | 1.89 | 1.89 | | 20 day SMA | 1.96 | 1.97 | 1.99 | | 35 day SMA | 2.14 | 2.16 | 2.17 | | 50 day SMA | 2.24 | 2.25 | 2.26 | | 100 day SMA | 2.11 | 2.1 | 2.09 | | 150 day SMA | 2.04 | 2.04 | 2.04 | | 200 day SMA | 2 | 2 | 2 |
|
|
