InmuneBio INMB full analysis,charts,indicators,moving averages,SMA,DMA,EMA,ADX,MACD,RSIInmune Bio INMB WideScreen charts, DMA,SMA,EMA technical analysis, forecast prediction, by indicators ADX,MACD,RSI,CCI USA stock exchange
operates under Health Care sector & deals in Biotechnology Biological Products No Diagnostic Substances
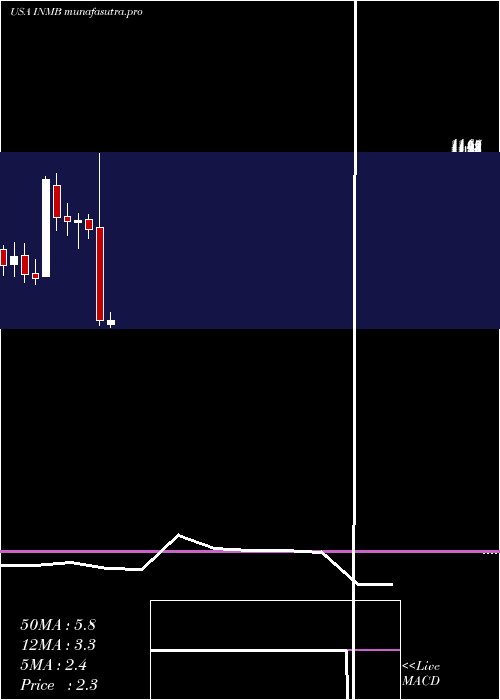
Daily price and charts and targets InmuneBio Strong Daily Stock price targets for InmuneBio INMB are 1.79 and 2.02 | Daily Target 1 | 1.6 | | Daily Target 2 | 1.75 | | Daily Target 3 | 1.8333333333333 | | Daily Target 4 | 1.98 | | Daily Target 5 | 2.06 |
Daily price and volume Inmune Bio
| Date |
Closing |
Open |
Range |
Volume |
Thu 04 December 2025 |
1.89 (7.39%) |
1.74 |
1.69 - 1.92 |
1.4877 times |
Wed 03 December 2025 |
1.76 (12.1%) |
1.56 |
1.54 - 1.79 |
1.1416 times |
Tue 02 December 2025 |
1.57 (0%) |
1.56 |
1.54 - 1.62 |
0.7841 times |
Mon 01 December 2025 |
1.57 (-9.77%) |
1.73 |
1.53 - 1.75 |
1.433 times |
Fri 28 November 2025 |
1.74 (5.45%) |
1.68 |
1.61 - 1.75 |
1.1708 times |
Wed 26 November 2025 |
1.65 (8.55%) |
1.52 |
1.52 - 1.71 |
1.2115 times |
Tue 25 November 2025 |
1.52 (2.7%) |
1.48 |
1.46 - 1.53 |
0.5771 times |
Mon 24 November 2025 |
1.48 (-1.99%) |
1.51 |
1.48 - 1.53 |
0.7846 times |
Fri 21 November 2025 |
1.51 (1.34%) |
1.51 |
1.45 - 1.54 |
0.6618 times |
Thu 20 November 2025 |
1.49 (-1.32%) |
1.54 |
1.48 - 1.62 |
0.7478 times |
Wed 19 November 2025 |
1.51 (0.67%) |
1.50 |
1.48 - 1.57 |
0.5168 times |
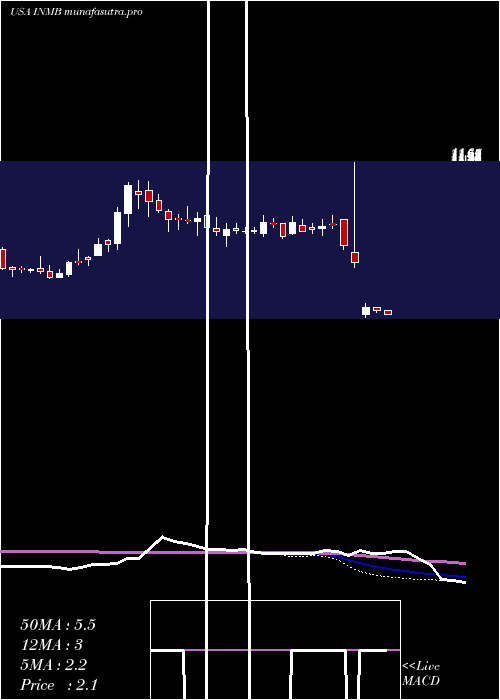
Weekly price and charts InmuneBio Strong weekly Stock price targets for InmuneBio INMB are 1.71 and 2.1 | Weekly Target 1 | 1.39 | | Weekly Target 2 | 1.64 | | Weekly Target 3 | 1.78 | | Weekly Target 4 | 2.03 | | Weekly Target 5 | 2.17 |
Weekly price and volumes for Inmune Bio
| Date |
Closing |
Open |
Range |
Volume |
Thu 04 December 2025 |
1.89 (8.62%) |
1.73 |
1.53 - 1.92 |
1.293 times |
Fri 28 November 2025 |
1.74 (15.23%) |
1.51 |
1.46 - 1.75 |
0.9989 times |
Fri 21 November 2025 |
1.51 (6.34%) |
1.42 |
1.40 - 1.62 |
1.1929 times |
Fri 14 November 2025 |
1.42 (-13.94%) |
1.64 |
1.38 - 1.69 |
1.0533 times |
Fri 07 November 2025 |
1.65 (-9.84%) |
1.77 |
1.53 - 1.80 |
0.804 times |
Fri 31 October 2025 |
1.83 (0%) |
1.75 |
1.75 - 1.93 |
0.3068 times |
Fri 31 October 2025 |
1.83 (-3.68%) |
1.90 |
1.73 - 1.95 |
1.0345 times |
Fri 24 October 2025 |
1.90 (2.7%) |
1.86 |
1.75 - 1.95 |
1.0041 times |
Fri 17 October 2025 |
1.85 (-0.54%) |
1.89 |
1.78 - 2.00 |
1.0108 times |
Fri 10 October 2025 |
1.86 (-10.58%) |
2.12 |
1.85 - 2.13 |
1.3016 times |
Fri 03 October 2025 |
2.08 (3.48%) |
2.06 |
2.00 - 2.18 |
1.072 times |
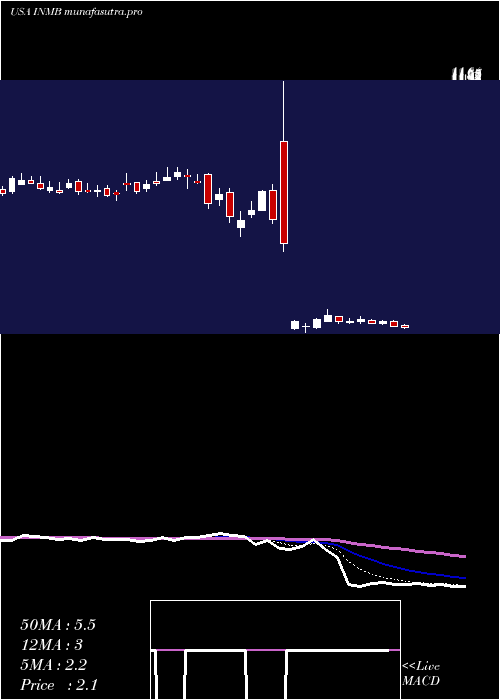
Monthly price and charts InmuneBio Strong monthly Stock price targets for InmuneBio INMB are 1.71 and 2.1 | Monthly Target 1 | 1.39 | | Monthly Target 2 | 1.64 | | Monthly Target 3 | 1.78 | | Monthly Target 4 | 2.03 | | Monthly Target 5 | 2.17 |
Monthly price and volumes Inmune Bio
| Date |
Closing |
Open |
Range |
Volume |
Thu 04 December 2025 |
1.89 (8.62%) |
1.73 |
1.53 - 1.92 |
0.0883 times |
Fri 28 November 2025 |
1.74 (-4.92%) |
1.77 |
1.38 - 1.80 |
0.2765 times |
Fri 31 October 2025 |
1.83 (-11.59%) |
2.09 |
1.73 - 2.16 |
0.3589 times |
Tue 30 September 2025 |
2.07 (1.97%) |
2.00 |
1.71 - 2.18 |
0.5807 times |
Fri 29 August 2025 |
2.03 (-25.64%) |
2.56 |
1.94 - 2.85 |
0.7675 times |
Thu 31 July 2025 |
2.73 (18.18%) |
2.09 |
1.89 - 3.24 |
2.6376 times |
Mon 30 June 2025 |
2.31 (-68.7%) |
7.47 |
2.00 - 11.64 |
4.6576 times |
Fri 30 May 2025 |
7.38 (-6.11%) |
7.93 |
6.85 - 8.20 |
0.2341 times |
Wed 30 April 2025 |
7.86 (0.64%) |
7.78 |
6.31 - 8.26 |
0.2092 times |
Mon 31 March 2025 |
7.81 (-2.74%) |
8.09 |
7.03 - 8.84 |
0.1897 times |
Fri 28 February 2025 |
8.03 (-20.96%) |
9.81 |
7.30 - 10.50 |
0.3065 times |
DMA SMA EMA moving averages of Inmune Bio INMB
DMA (daily moving average) of Inmune Bio INMB
| DMA period | DMA value | | 5 day DMA | 1.71 | | 12 day DMA | 1.6 | | 20 day DMA | 1.57 | | 35 day DMA | 1.68 | | 50 day DMA | 1.78 | | 100 day DMA | 2.04 | | 150 day DMA | 3.43 | | 200 day DMA | 4.54 | EMA (exponential moving average) of Inmune Bio INMB
| EMA period | EMA current | EMA prev | EMA prev2 | | 5 day EMA | 1.73 | 1.65 | 1.59 | | 12 day EMA | 1.65 | 1.61 | 1.58 | | 20 day EMA | 1.65 | 1.62 | 1.61 | | 35 day EMA | 1.69 | 1.68 | 1.68 | | 50 day EMA | 1.78 | 1.78 | 1.78 |
SMA (simple moving average) of Inmune Bio INMB
| SMA period | SMA current | SMA prev | SMA prev2 | | 5 day SMA | 1.71 | 1.66 | 1.61 | | 12 day SMA | 1.6 | 1.56 | 1.54 | | 20 day SMA | 1.57 | 1.56 | 1.56 | | 35 day SMA | 1.68 | 1.68 | 1.68 | | 50 day SMA | 1.78 | 1.78 | 1.78 | | 100 day SMA | 2.04 | 2.04 | 2.04 | | 150 day SMA | 3.43 | 3.47 | 3.51 | | 200 day SMA | 4.54 | 4.58 | 4.62 |
|
|
