IndependentBank INDB full analysis,charts,indicators,moving averages,SMA,DMA,EMA,ADX,MACD,RSIIndependent Bank INDB WideScreen charts, DMA,SMA,EMA technical analysis, forecast prediction, by indicators ADX,MACD,RSI,CCI USA stock exchange
operates under Finance sector & deals in Major Banks
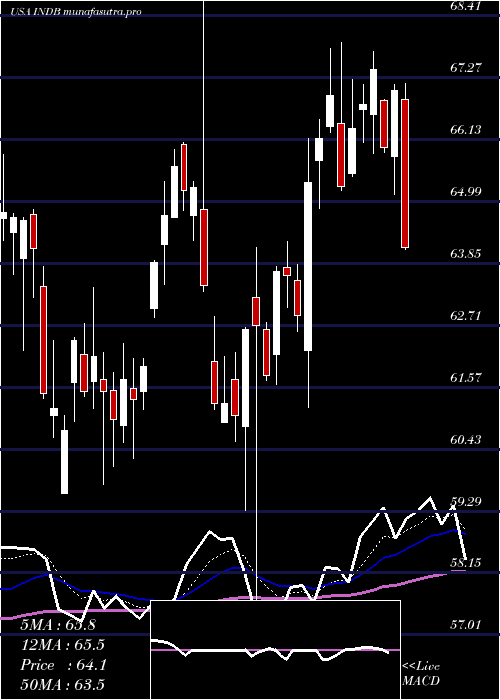
Daily price and charts and targets IndependentBank Strong Daily Stock price targets for IndependentBank INDB are 73.13 and 74.05 | Daily Target 1 | 72.92 | | Daily Target 2 | 73.33 | | Daily Target 3 | 73.843333333333 | | Daily Target 4 | 74.25 | | Daily Target 5 | 74.76 |
Daily price and volume Independent Bank
| Date |
Closing |
Open |
Range |
Volume |
Thu 04 December 2025 |
73.73 (-0.41%) |
73.88 |
73.44 - 74.36 |
0.6164 times |
Wed 03 December 2025 |
74.03 (1.04%) |
73.44 |
72.58 - 74.66 |
0.9787 times |
Tue 02 December 2025 |
73.27 (0%) |
73.72 |
72.70 - 74.15 |
0.7062 times |
Mon 01 December 2025 |
73.27 (1.69%) |
71.39 |
70.82 - 73.51 |
0.6395 times |
Fri 28 November 2025 |
72.05 (-1.06%) |
72.80 |
71.83 - 72.80 |
0.4035 times |
Wed 26 November 2025 |
72.82 (-1.26%) |
73.15 |
72.65 - 73.99 |
1.9242 times |
Tue 25 November 2025 |
73.75 (3.93%) |
71.38 |
71.38 - 74.33 |
1.542 times |
Mon 24 November 2025 |
70.96 (1.57%) |
69.94 |
68.29 - 71.30 |
1.1061 times |
Fri 21 November 2025 |
69.86 (4.41%) |
67.14 |
67.00 - 70.55 |
1.1393 times |
Thu 20 November 2025 |
66.91 (-0.42%) |
68.01 |
66.78 - 69.08 |
0.9441 times |
Wed 19 November 2025 |
67.19 (0.92%) |
66.60 |
66.17 - 67.40 |
0.7593 times |
Weekly price and charts IndependentBank Strong weekly Stock price targets for IndependentBank INDB are 72.28 and 76.12 | Weekly Target 1 | 69.23 | | Weekly Target 2 | 71.48 | | Weekly Target 3 | 73.07 | | Weekly Target 4 | 75.32 | | Weekly Target 5 | 76.91 |
Weekly price and volumes for Independent Bank
| Date |
Closing |
Open |
Range |
Volume |
Thu 04 December 2025 |
73.73 (2.33%) |
71.39 |
70.82 - 74.66 |
0.6443 times |
Fri 28 November 2025 |
72.05 (3.13%) |
69.94 |
68.29 - 74.33 |
1.0902 times |
Fri 21 November 2025 |
69.86 (1.01%) |
69.12 |
66.17 - 70.55 |
1.1355 times |
Fri 14 November 2025 |
69.16 (-1.87%) |
70.85 |
67.50 - 71.34 |
1.1032 times |
Fri 07 November 2025 |
70.48 (4.74%) |
66.50 |
66.50 - 70.66 |
1.0314 times |
Fri 31 October 2025 |
67.29 (0%) |
67.35 |
66.12 - 67.44 |
0.2329 times |
Fri 31 October 2025 |
67.29 (-2.76%) |
69.30 |
65.45 - 69.68 |
0.9498 times |
Fri 24 October 2025 |
69.20 (4.48%) |
66.64 |
66.24 - 69.61 |
1.139 times |
Fri 17 October 2025 |
66.23 (1.11%) |
66.50 |
63.33 - 70.26 |
1.4989 times |
Fri 10 October 2025 |
65.50 (-5.69%) |
69.31 |
65.28 - 71.59 |
1.1748 times |
Fri 03 October 2025 |
69.45 (-2.17%) |
70.36 |
67.85 - 70.56 |
0.8702 times |
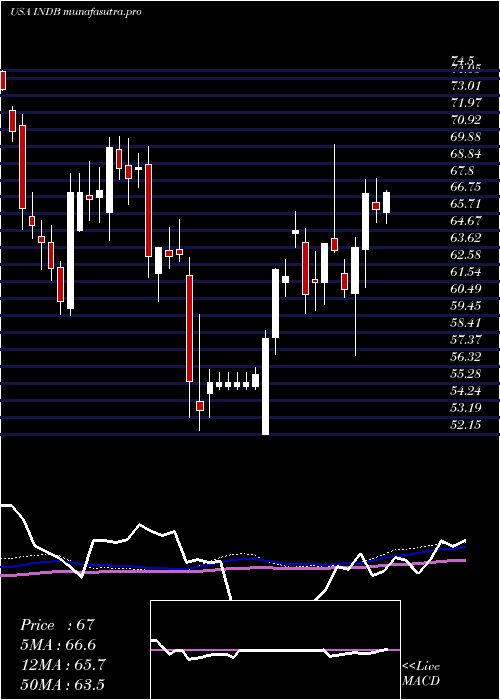
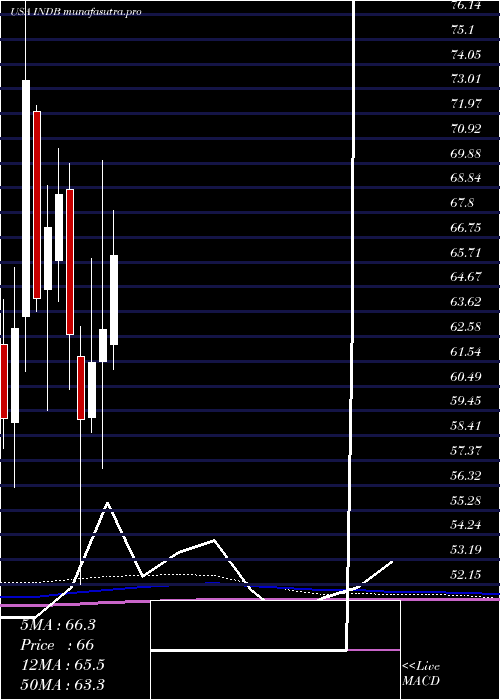
Monthly price and charts IndependentBank Strong monthly Stock price targets for IndependentBank INDB are 72.28 and 76.12 | Monthly Target 1 | 69.23 | | Monthly Target 2 | 71.48 | | Monthly Target 3 | 73.07 | | Monthly Target 4 | 75.32 | | Monthly Target 5 | 76.91 |
Monthly price and volumes Independent Bank
| Date |
Closing |
Open |
Range |
Volume |
Thu 04 December 2025 |
73.73 (2.33%) |
71.39 |
70.82 - 74.66 |
0.1272 times |
Fri 28 November 2025 |
72.05 (7.07%) |
66.50 |
66.17 - 74.33 |
0.8609 times |
Fri 31 October 2025 |
67.29 (-2.72%) |
68.58 |
63.33 - 71.59 |
1.0881 times |
Tue 30 September 2025 |
69.17 (-3.27%) |
70.77 |
67.84 - 73.36 |
0.9992 times |
Fri 29 August 2025 |
71.51 (12.53%) |
62.78 |
61.55 - 72.56 |
1.0139 times |
Thu 31 July 2025 |
63.55 (1.05%) |
62.24 |
61.19 - 71.19 |
1.7994 times |
Mon 30 June 2025 |
62.89 (2.26%) |
61.52 |
57.01 - 70.00 |
0.9917 times |
Fri 30 May 2025 |
61.50 (4.08%) |
59.17 |
58.55 - 65.85 |
0.9285 times |
Wed 30 April 2025 |
59.09 (-5.68%) |
61.72 |
52.15 - 63.02 |
1.1478 times |
Mon 31 March 2025 |
62.65 (-8.62%) |
68.78 |
60.34 - 69.85 |
1.0432 times |
Fri 28 February 2025 |
68.56 (2.08%) |
65.77 |
64.07 - 70.48 |
0.7559 times |
DMA SMA EMA moving averages of Independent Bank INDB
DMA (daily moving average) of Independent Bank INDB
| DMA period | DMA value | | 5 day DMA | 73.27 | | 12 day DMA | 71.2 | | 20 day DMA | 70.42 | | 35 day DMA | 69.29 | | 50 day DMA | 69.25 | | 100 day DMA | 68.79 | | 150 day DMA | 66.99 | | 200 day DMA | 65.42 | EMA (exponential moving average) of Independent Bank INDB
| EMA period | EMA current | EMA prev | EMA prev2 | | 5 day EMA | 73.26 | 73.03 | 72.53 | | 12 day EMA | 71.92 | 71.59 | 71.15 | | 20 day EMA | 71.01 | 70.72 | 70.37 | | 35 day EMA | 70.29 | 70.09 | 69.86 | | 50 day EMA | 69.8 | 69.64 | 69.46 |
SMA (simple moving average) of Independent Bank INDB
| SMA period | SMA current | SMA prev | SMA prev2 | | 5 day SMA | 73.27 | 73.09 | 73.03 | | 12 day SMA | 71.2 | 70.6 | 70.19 | | 20 day SMA | 70.42 | 70.22 | 69.93 | | 35 day SMA | 69.29 | 69.12 | 69 | | 50 day SMA | 69.25 | 69.18 | 69.11 | | 100 day SMA | 68.79 | 68.69 | 68.62 | | 150 day SMA | 66.99 | 66.9 | 66.8 | | 200 day SMA | 65.42 | 65.4 | 65.38 |
|
|
