InternationalMoney IMXI full analysis,charts,indicators,moving averages,SMA,DMA,EMA,ADX,MACD,RSIInternational Money IMXI WideScreen charts, DMA,SMA,EMA technical analysis, forecast prediction, by indicators ADX,MACD,RSI,CCI USA stock exchange
operates under Miscellaneous sector & deals in Business Services
Daily price and charts and targets InternationalMoney Strong Daily Stock price targets for InternationalMoney IMXI are 15.33 and 15.38 | Daily Target 1 | 15.28 | | Daily Target 2 | 15.32 | | Daily Target 3 | 15.333333333333 | | Daily Target 4 | 15.37 | | Daily Target 5 | 15.38 |
Daily price and volume International Money
| Date |
Closing |
Open |
Range |
Volume |
Thu 04 December 2025 |
15.35 (-0.07%) |
15.30 |
15.30 - 15.35 |
0.6552 times |
Wed 03 December 2025 |
15.36 (0.39%) |
15.35 |
15.29 - 15.36 |
1.0054 times |
Tue 02 December 2025 |
15.30 (0%) |
15.30 |
15.25 - 15.31 |
0.9396 times |
Mon 01 December 2025 |
15.30 (0.39%) |
15.17 |
15.17 - 15.34 |
0.8629 times |
Fri 28 November 2025 |
15.24 (0.53%) |
15.19 |
15.16 - 15.24 |
0.5325 times |
Wed 26 November 2025 |
15.16 (0.26%) |
15.10 |
15.10 - 15.20 |
1.5745 times |
Tue 25 November 2025 |
15.12 (0.4%) |
15.07 |
15.07 - 15.13 |
1.2065 times |
Mon 24 November 2025 |
15.06 (-0.2%) |
15.08 |
15.06 - 15.11 |
1.4002 times |
Fri 21 November 2025 |
15.09 (0%) |
15.08 |
15.08 - 15.12 |
0.7845 times |
Thu 20 November 2025 |
15.09 (0.13%) |
15.11 |
15.07 - 15.11 |
1.0387 times |
Wed 19 November 2025 |
15.07 (-0.07%) |
15.12 |
15.07 - 15.12 |
0.7981 times |
Weekly price and charts InternationalMoney Strong weekly Stock price targets for InternationalMoney IMXI are 15.26 and 15.45 | Weekly Target 1 | 15.1 | | Weekly Target 2 | 15.23 | | Weekly Target 3 | 15.293333333333 | | Weekly Target 4 | 15.42 | | Weekly Target 5 | 15.48 |
Weekly price and volumes for International Money
| Date |
Closing |
Open |
Range |
Volume |
Thu 04 December 2025 |
15.35 (0.72%) |
15.17 |
15.17 - 15.36 |
0.5139 times |
Fri 28 November 2025 |
15.24 (0.99%) |
15.08 |
15.06 - 15.24 |
0.6995 times |
Fri 21 November 2025 |
15.09 (-0.07%) |
15.10 |
15.02 - 15.12 |
0.7349 times |
Fri 14 November 2025 |
15.10 (-0.26%) |
15.18 |
15.00 - 15.20 |
0.9371 times |
Fri 07 November 2025 |
15.14 (1.68%) |
14.86 |
14.84 - 15.15 |
0.7978 times |
Fri 31 October 2025 |
14.89 (0%) |
14.85 |
14.83 - 14.90 |
0.2065 times |
Fri 31 October 2025 |
14.89 (0.13%) |
14.87 |
14.81 - 14.91 |
1.461 times |
Fri 24 October 2025 |
14.87 (0.75%) |
14.82 |
14.71 - 14.90 |
0.9435 times |
Fri 17 October 2025 |
14.76 (1.79%) |
14.65 |
14.59 - 15.05 |
1.3075 times |
Fri 10 October 2025 |
14.50 (3.2%) |
14.12 |
13.94 - 15.07 |
2.3984 times |
Fri 03 October 2025 |
14.05 (-1.13%) |
14.23 |
13.90 - 14.28 |
1.3591 times |
Monthly price and charts InternationalMoney Strong monthly Stock price targets for InternationalMoney IMXI are 15.26 and 15.45 | Monthly Target 1 | 15.1 | | Monthly Target 2 | 15.23 | | Monthly Target 3 | 15.293333333333 | | Monthly Target 4 | 15.42 | | Monthly Target 5 | 15.48 |
Monthly price and volumes International Money
| Date |
Closing |
Open |
Range |
Volume |
Thu 04 December 2025 |
15.35 (0.72%) |
15.17 |
15.17 - 15.36 |
0.0868 times |
Fri 28 November 2025 |
15.24 (2.35%) |
14.86 |
14.84 - 15.24 |
0.5354 times |
Fri 31 October 2025 |
14.89 (6.59%) |
13.97 |
13.92 - 15.07 |
1.225 times |
Tue 30 September 2025 |
13.97 (-3.66%) |
14.40 |
13.90 - 14.71 |
0.8364 times |
Fri 29 August 2025 |
14.50 (61.29%) |
8.85 |
8.58 - 15.27 |
3.0898 times |
Thu 31 July 2025 |
8.99 (-10.9%) |
10.10 |
8.83 - 10.87 |
0.7843 times |
Mon 30 June 2025 |
10.09 (-8.52%) |
10.96 |
9.76 - 11.80 |
0.7753 times |
Fri 30 May 2025 |
11.03 (-11.19%) |
12.40 |
10.07 - 12.67 |
1.0121 times |
Wed 30 April 2025 |
12.42 (-1.58%) |
12.63 |
11.27 - 13.11 |
0.7446 times |
Mon 31 March 2025 |
12.62 (-17.62%) |
15.29 |
12.57 - 15.98 |
0.9103 times |
Fri 28 February 2025 |
15.32 (-18.98%) |
18.52 |
14.99 - 19.24 |
0.7438 times |
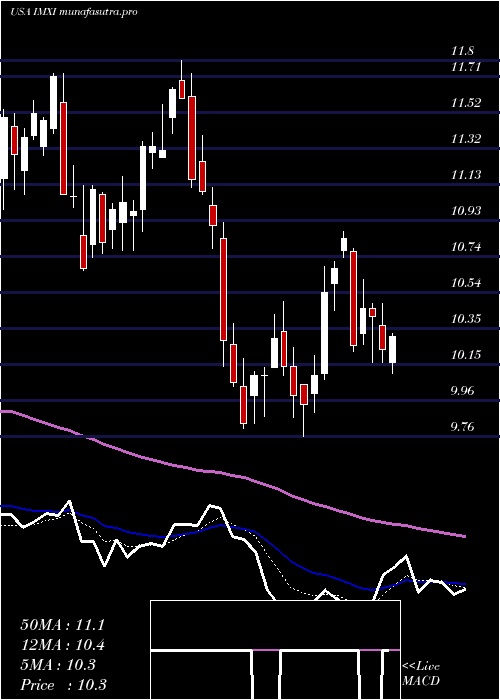
DMA SMA EMA moving averages of International Money IMXI
DMA (daily moving average) of International Money IMXI
| DMA period | DMA value | | 5 day DMA | 15.31 | | 12 day DMA | 15.19 | | 20 day DMA | 15.15 | | 35 day DMA | 15.02 | | 50 day DMA | 14.81 | | 100 day DMA | 13.79 | | 150 day DMA | 12.82 | | 200 day DMA | 13.05 | EMA (exponential moving average) of International Money IMXI
| EMA period | EMA current | EMA prev | EMA prev2 | | 5 day EMA | 15.3 | 15.27 | 15.23 | | 12 day EMA | 15.21 | 15.19 | 15.16 | | 20 day EMA | 15.13 | 15.11 | 15.08 | | 35 day EMA | 14.99 | 14.97 | 14.95 | | 50 day EMA | 14.82 | 14.8 | 14.78 |
SMA (simple moving average) of International Money IMXI
| SMA period | SMA current | SMA prev | SMA prev2 | | 5 day SMA | 15.31 | 15.27 | 15.22 | | 12 day SMA | 15.19 | 15.16 | 15.14 | | 20 day SMA | 15.15 | 15.13 | 15.11 | | 35 day SMA | 15.02 | 15 | 14.99 | | 50 day SMA | 14.81 | 14.79 | 14.77 | | 100 day SMA | 13.79 | 13.74 | 13.68 | | 150 day SMA | 12.82 | 12.8 | 12.79 | | 200 day SMA | 13.05 | 13.06 | 13.08 |
|
|
