InsteelIndustries IIIN full analysis,charts,indicators,moving averages,SMA,DMA,EMA,ADX,MACD,RSIInsteel Industries IIIN WideScreen charts, DMA,SMA,EMA technical analysis, forecast prediction, by indicators ADX,MACD,RSI,CCI USA stock exchange
operates under Capital Goods sector & deals in Steel Iron Ore
Daily price and charts and targets InsteelIndustries Strong Daily Stock price targets for InsteelIndustries IIIN are 31.32 and 31.76 | Daily Target 1 | 31 | | Daily Target 2 | 31.2 | | Daily Target 3 | 31.436666666667 | | Daily Target 4 | 31.64 | | Daily Target 5 | 31.88 |
Daily price and volume Insteel Industries
| Date |
Closing |
Open |
Range |
Volume |
Thu 04 December 2025 |
31.41 (-0.03%) |
31.40 |
31.23 - 31.67 |
0.9323 times |
Wed 03 December 2025 |
31.42 (2.98%) |
30.71 |
30.63 - 31.60 |
0.9027 times |
Tue 02 December 2025 |
30.51 (0.3%) |
30.45 |
30.19 - 30.64 |
0.7333 times |
Mon 01 December 2025 |
30.42 (-0.52%) |
30.34 |
30.24 - 30.59 |
1.0966 times |
Fri 28 November 2025 |
30.58 (-3.41%) |
30.85 |
30.26 - 30.85 |
0.6012 times |
Wed 26 November 2025 |
31.66 (0.19%) |
31.40 |
31.40 - 32.14 |
1.6868 times |
Tue 25 November 2025 |
31.60 (2.63%) |
31.03 |
31.03 - 31.91 |
0.9738 times |
Mon 24 November 2025 |
30.79 (0.42%) |
30.64 |
30.00 - 30.88 |
1.0407 times |
Fri 21 November 2025 |
30.66 (1.93%) |
30.03 |
29.82 - 31.01 |
1.2414 times |
Thu 20 November 2025 |
30.08 (-1.18%) |
30.68 |
30.02 - 30.82 |
0.7909 times |
Wed 19 November 2025 |
30.44 (-0.62%) |
30.77 |
30.33 - 30.79 |
0.6935 times |
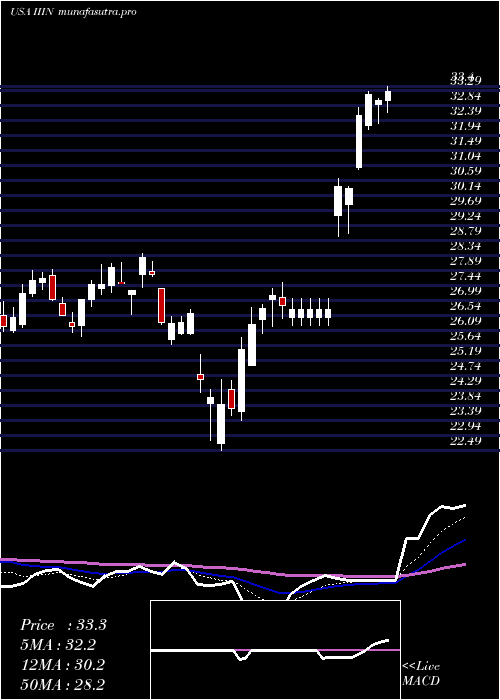
Weekly price and charts InsteelIndustries Strong weekly Stock price targets for InsteelIndustries IIIN are 30.8 and 32.28 | Weekly Target 1 | 29.61 | | Weekly Target 2 | 30.51 | | Weekly Target 3 | 31.09 | | Weekly Target 4 | 31.99 | | Weekly Target 5 | 32.57 |
Weekly price and volumes for Insteel Industries
| Date |
Closing |
Open |
Range |
Volume |
Thu 04 December 2025 |
31.41 (2.71%) |
30.34 |
30.19 - 31.67 |
0.7758 times |
Fri 28 November 2025 |
30.58 (-0.26%) |
30.64 |
30.00 - 32.14 |
0.9108 times |
Fri 21 November 2025 |
30.66 (-3.98%) |
31.86 |
29.82 - 31.86 |
1.0015 times |
Fri 14 November 2025 |
31.93 (1.95%) |
31.51 |
31.09 - 32.87 |
0.7835 times |
Fri 07 November 2025 |
31.32 (0.26%) |
30.99 |
30.77 - 32.09 |
0.7188 times |
Fri 31 October 2025 |
31.24 (0%) |
31.08 |
30.76 - 31.81 |
0.2495 times |
Fri 31 October 2025 |
31.24 (1.4%) |
30.81 |
30.01 - 31.81 |
1.4799 times |
Fri 24 October 2025 |
30.81 (-0.16%) |
30.95 |
30.16 - 31.96 |
1.4127 times |
Fri 17 October 2025 |
30.86 (-20.48%) |
38.94 |
29.83 - 39.03 |
2.0398 times |
Fri 03 October 2025 |
38.81 (0.83%) |
38.66 |
37.72 - 39.22 |
0.6277 times |
Fri 26 September 2025 |
38.49 (-0.03%) |
38.53 |
38.06 - 39.21 |
0.6181 times |
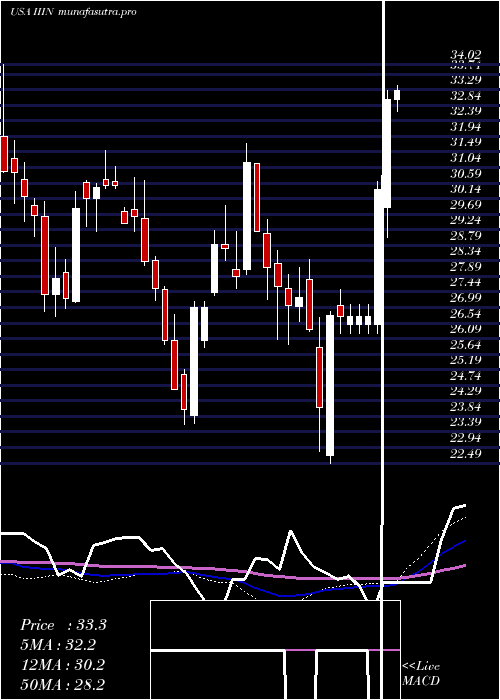
Monthly price and charts InsteelIndustries Strong monthly Stock price targets for InsteelIndustries IIIN are 30.8 and 32.28 | Monthly Target 1 | 29.61 | | Monthly Target 2 | 30.51 | | Monthly Target 3 | 31.09 | | Monthly Target 4 | 31.99 | | Monthly Target 5 | 32.57 |
Monthly price and volumes Insteel Industries
| Date |
Closing |
Open |
Range |
Volume |
Thu 04 December 2025 |
31.41 (2.71%) |
30.34 |
30.19 - 31.67 |
0.1706 times |
Fri 28 November 2025 |
30.58 (-2.11%) |
30.99 |
29.82 - 32.87 |
0.7507 times |
Fri 31 October 2025 |
31.24 (-18.52%) |
38.01 |
29.83 - 39.22 |
1.2245 times |
Tue 30 September 2025 |
38.34 (-0.1%) |
37.94 |
37.29 - 39.91 |
0.709 times |
Fri 29 August 2025 |
38.38 (6.32%) |
35.55 |
34.68 - 39.20 |
0.8616 times |
Thu 31 July 2025 |
36.10 (-2.98%) |
37.09 |
35.04 - 41.64 |
1.3392 times |
Mon 30 June 2025 |
37.21 (6.25%) |
35.04 |
34.30 - 37.98 |
1.0188 times |
Fri 30 May 2025 |
35.02 (3.27%) |
34.07 |
33.15 - 37.61 |
1.1403 times |
Wed 30 April 2025 |
33.91 (28.94%) |
26.00 |
22.49 - 34.07 |
1.4759 times |
Mon 31 March 2025 |
26.30 (-6.54%) |
28.25 |
25.69 - 28.64 |
1.3095 times |
Fri 28 February 2025 |
28.14 (-1.92%) |
28.08 |
27.23 - 31.73 |
1.1347 times |

DMA SMA EMA moving averages of Insteel Industries IIIN
DMA (daily moving average) of Insteel Industries IIIN
| DMA period | DMA value | | 5 day DMA | 30.87 | | 12 day DMA | 30.85 | | 20 day DMA | 31.16 | | 35 day DMA | 31.13 | | 50 day DMA | 33.33 | | 100 day DMA | 35.46 | | 150 day DMA | 35.6 | | 200 day DMA | 33.6 | EMA (exponential moving average) of Insteel Industries IIIN
| EMA period | EMA current | EMA prev | EMA prev2 | | 5 day EMA | 31.1 | 30.95 | 30.71 | | 12 day EMA | 31.06 | 31 | 30.92 | | 20 day EMA | 31.29 | 31.28 | 31.27 | | 35 day EMA | 32.44 | 32.5 | 32.56 | | 50 day EMA | 33.52 | 33.61 | 33.7 |
SMA (simple moving average) of Insteel Industries IIIN
| SMA period | SMA current | SMA prev | SMA prev2 | | 5 day SMA | 30.87 | 30.92 | 30.95 | | 12 day SMA | 30.85 | 30.76 | 30.81 | | 20 day SMA | 31.16 | 31.19 | 31.19 | | 35 day SMA | 31.13 | 31.3 | 31.5 | | 50 day SMA | 33.33 | 33.46 | 33.6 | | 100 day SMA | 35.46 | 35.53 | 35.6 | | 150 day SMA | 35.6 | 35.61 | 35.6 | | 200 day SMA | 33.6 | 33.6 | 33.59 |
|
|
