IntercontinentalHotels IHG full analysis,charts,indicators,moving averages,SMA,DMA,EMA,ADX,MACD,RSIIntercontinental Hotels IHG WideScreen charts, DMA,SMA,EMA technical analysis, forecast prediction, by indicators ADX,MACD,RSI,CCI USA stock exchange
operates under Consumer Services sector & deals in Hotels Resorts
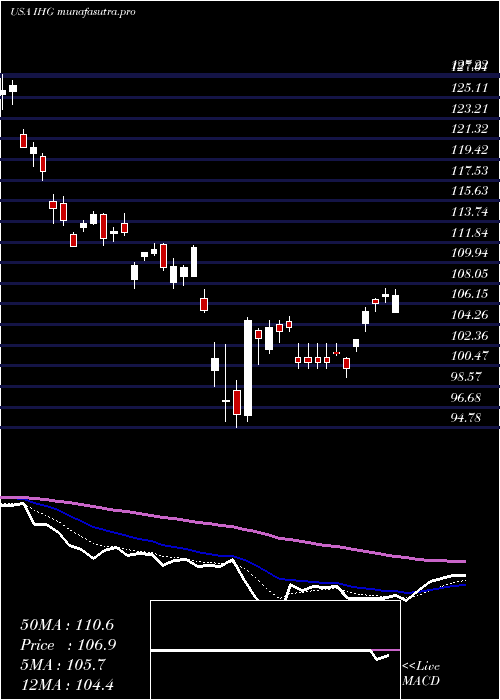
Daily price and charts and targets IntercontinentalHotels Strong Daily Stock price targets for IntercontinentalHotels IHG are 119.53 and 120.93 | Daily Target 1 | 119.27 | | Daily Target 2 | 119.79 | | Daily Target 3 | 120.66666666667 | | Daily Target 4 | 121.19 | | Daily Target 5 | 122.07 |
Daily price and volume Intercontinental Hotels
| Date |
Closing |
Open |
Range |
Volume |
Mon 20 October 2025 |
120.32 (-0.41%) |
121.09 |
120.14 - 121.54 |
0.6029 times |
Fri 17 October 2025 |
120.81 (1.79%) |
119.49 |
119.42 - 120.90 |
0.7963 times |
Thu 16 October 2025 |
118.68 (-1.38%) |
120.03 |
118.47 - 120.86 |
1.1571 times |
Wed 15 October 2025 |
120.34 (-1.58%) |
121.78 |
119.64 - 122.69 |
0.9851 times |
Tue 14 October 2025 |
122.27 (-0.23%) |
120.21 |
120.14 - 122.80 |
1.3297 times |
Mon 13 October 2025 |
122.55 (-0.53%) |
121.17 |
121.17 - 122.83 |
1.0343 times |
Tue 07 October 2025 |
123.20 (-0.88%) |
124.11 |
122.97 - 124.37 |
1.6019 times |
Mon 06 October 2025 |
124.30 (0.31%) |
124.29 |
123.44 - 124.65 |
0.2855 times |
Fri 03 October 2025 |
123.92 (0.62%) |
123.95 |
123.57 - 124.74 |
1.6488 times |
Thu 02 October 2025 |
123.16 (1.47%) |
122.22 |
121.77 - 123.38 |
0.5586 times |
Wed 01 October 2025 |
121.37 (0.09%) |
122.63 |
120.93 - 122.81 |
1.2283 times |
Weekly price and charts IntercontinentalHotels Strong weekly Stock price targets for IntercontinentalHotels IHG are 119.53 and 120.93 | Weekly Target 1 | 119.27 | | Weekly Target 2 | 119.79 | | Weekly Target 3 | 120.66666666667 | | Weekly Target 4 | 121.19 | | Weekly Target 5 | 122.07 |
Weekly price and volumes for Intercontinental Hotels
| Date |
Closing |
Open |
Range |
Volume |
Mon 20 October 2025 |
120.32 (-0.41%) |
121.09 |
120.14 - 121.54 |
0.1744 times |
Fri 17 October 2025 |
120.81 (-1.94%) |
121.17 |
118.47 - 122.83 |
1.5336 times |
Tue 07 October 2025 |
123.20 (-0.58%) |
124.29 |
122.97 - 124.65 |
0.5459 times |
Fri 03 October 2025 |
123.92 (0.56%) |
124.43 |
120.93 - 124.74 |
1.5173 times |
Fri 26 September 2025 |
123.23 (2.89%) |
118.95 |
117.29 - 123.33 |
1.1971 times |
Fri 19 September 2025 |
119.77 (-1.03%) |
120.95 |
118.02 - 121.30 |
1.268 times |
Fri 12 September 2025 |
121.02 (-1.79%) |
124.42 |
121.01 - 125.32 |
1.455 times |
Fri 05 September 2025 |
123.22 (0.47%) |
118.91 |
118.91 - 125.25 |
1.1582 times |
Fri 29 August 2025 |
122.64 (0%) |
122.57 |
121.75 - 122.91 |
0.1988 times |
Fri 29 August 2025 |
122.64 (-0.07%) |
122.41 |
120.81 - 123.83 |
0.9517 times |
Fri 22 August 2025 |
122.72 (1.36%) |
120.06 |
119.65 - 123.15 |
1.5246 times |
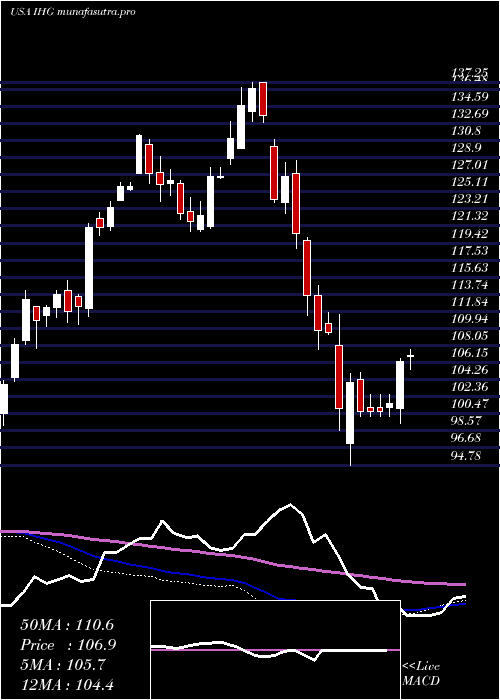
Monthly price and charts IntercontinentalHotels Strong monthly Stock price targets for IntercontinentalHotels IHG are 116.26 and 122.53 | Monthly Target 1 | 114.91 | | Monthly Target 2 | 117.61 | | Monthly Target 3 | 121.17666666667 | | Monthly Target 4 | 123.88 | | Monthly Target 5 | 127.45 |
Monthly price and volumes Intercontinental Hotels
| Date |
Closing |
Open |
Range |
Volume |
Mon 20 October 2025 |
120.32 (-0.78%) |
122.63 |
118.47 - 124.74 |
0.4641 times |
Tue 30 September 2025 |
121.26 (-1.13%) |
118.91 |
117.29 - 125.32 |
0.8005 times |
Fri 29 August 2025 |
122.64 (5.58%) |
114.91 |
113.32 - 126.84 |
0.9949 times |
Thu 31 July 2025 |
116.16 (0.71%) |
115.82 |
115.13 - 122.55 |
0.9632 times |
Mon 30 June 2025 |
115.34 (-0.43%) |
115.51 |
109.79 - 118.23 |
1.1278 times |
Fri 30 May 2025 |
115.84 (7.37%) |
109.40 |
109.19 - 124.84 |
1.1784 times |
Wed 30 April 2025 |
107.89 (-1.55%) |
108.70 |
94.78 - 111.54 |
1.4917 times |
Mon 31 March 2025 |
109.59 (-13.6%) |
127.18 |
107.57 - 128.54 |
1.0322 times |
Fri 28 February 2025 |
126.84 (-5.85%) |
134.00 |
122.73 - 137.25 |
1.3113 times |
Fri 31 January 2025 |
134.72 (7.85%) |
125.11 |
120.68 - 136.67 |
0.6358 times |
Tue 31 December 2024 |
124.92 (-0.62%) |
127.10 |
124.04 - 131.51 |
0.4733 times |

DMA SMA EMA moving averages of Intercontinental Hotels IHG
DMA (daily moving average) of Intercontinental Hotels IHG
| DMA period | DMA value | | 5 day DMA | 120.48 | | 12 day DMA | 121.85 | | 20 day DMA | 120.96 | | 35 day DMA | 121.37 | | 50 day DMA | 121.27 | | 100 day DMA | 118.96 | | 150 day DMA | 115.95 | | 200 day DMA | 118.94 | EMA (exponential moving average) of Intercontinental Hotels IHG
| EMA period | EMA current | EMA prev | EMA prev2 | | 5 day EMA | 120.67 | 120.84 | 120.85 | | 12 day EMA | 121.17 | 121.32 | 121.41 | | 20 day EMA | 121.21 | 121.3 | 121.35 | | 35 day EMA | 121.02 | 121.06 | 121.08 | | 50 day EMA | 120.77 | 120.79 | 120.79 |
SMA (simple moving average) of Intercontinental Hotels IHG
| SMA period | SMA current | SMA prev | SMA prev2 | | 5 day SMA | 120.48 | 120.93 | 121.41 | | 12 day SMA | 121.85 | 122.05 | 122.25 | | 20 day SMA | 120.96 | 120.87 | 120.86 | | 35 day SMA | 121.37 | 121.43 | 121.43 | | 50 day SMA | 121.27 | 121.2 | 121.09 | | 100 day SMA | 118.96 | 118.94 | 118.93 | | 150 day SMA | 115.95 | 115.92 | 115.9 | | 200 day SMA | 118.94 | 118.97 | 119 |
|
|
