CbreClarion IGR full analysis,charts,indicators,moving averages,SMA,DMA,EMA,ADX,MACD,RSICbre Clarion IGR WideScreen charts, DMA,SMA,EMA technical analysis, forecast prediction, by indicators ADX,MACD,RSI,CCI USA stock exchange
operates under N A sector & deals in N A
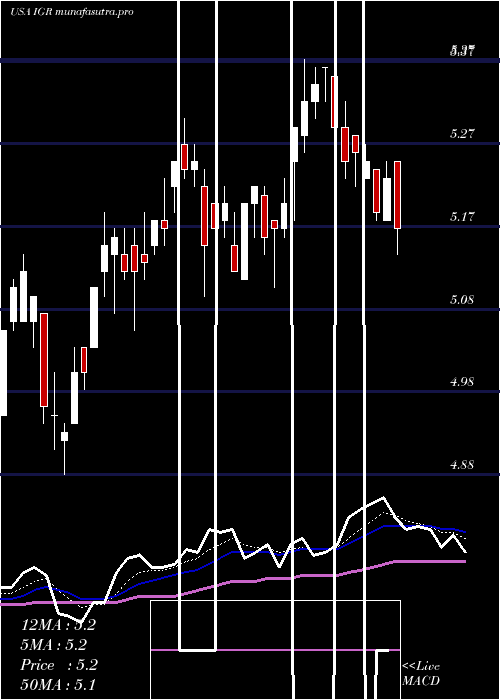
Daily price and charts and targets CbreClarion Strong Daily Stock price targets for CbreClarion IGR are 4.95 and 5 | Daily Target 1 | 4.93 | | Daily Target 2 | 4.95 | | Daily Target 3 | 4.98 | | Daily Target 4 | 5 | | Daily Target 5 | 5.03 |
Daily price and volume Cbre Clarion
| Date |
Closing |
Open |
Range |
Volume |
Mon 20 October 2025 |
4.97 (-1.19%) |
4.97 |
4.96 - 5.01 |
1.2465 times |
Fri 17 October 2025 |
5.03 (-0.2%) |
5.04 |
5.00 - 5.05 |
1.0482 times |
Thu 16 October 2025 |
5.04 (0.4%) |
5.06 |
5.00 - 5.06 |
1.1339 times |
Wed 15 October 2025 |
5.02 (1.01%) |
4.99 |
4.97 - 5.06 |
1.294 times |
Tue 14 October 2025 |
4.97 (-0.6%) |
4.98 |
4.95 - 5.01 |
1.1293 times |
Mon 13 October 2025 |
5.00 (-2.53%) |
4.95 |
4.95 - 5.01 |
0.9424 times |
Tue 07 October 2025 |
5.13 (-0.58%) |
5.17 |
5.11 - 5.17 |
0.9041 times |
Mon 06 October 2025 |
5.16 (0%) |
5.16 |
5.14 - 5.19 |
0.9096 times |
Fri 03 October 2025 |
5.16 (0%) |
5.17 |
5.14 - 5.20 |
0.7799 times |
Thu 02 October 2025 |
5.16 (0%) |
5.18 |
5.08 - 5.18 |
0.6121 times |
Wed 01 October 2025 |
5.16 (0.39%) |
5.15 |
5.12 - 5.17 |
0.9634 times |
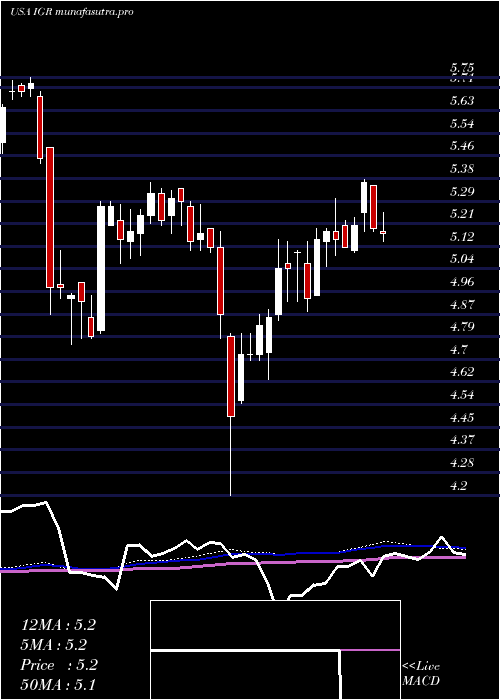
Weekly price and charts CbreClarion Strong weekly Stock price targets for CbreClarion IGR are 4.95 and 5 | Weekly Target 1 | 4.93 | | Weekly Target 2 | 4.95 | | Weekly Target 3 | 4.98 | | Weekly Target 4 | 5 | | Weekly Target 5 | 5.03 |
Weekly price and volumes for Cbre Clarion
| Date |
Closing |
Open |
Range |
Volume |
Mon 20 October 2025 |
4.97 (-1.19%) |
4.97 |
4.96 - 5.01 |
0.3482 times |
Fri 17 October 2025 |
5.03 (-1.95%) |
4.95 |
4.95 - 5.06 |
1.5496 times |
Tue 07 October 2025 |
5.13 (-0.58%) |
5.16 |
5.11 - 5.19 |
0.5066 times |
Fri 03 October 2025 |
5.16 (2.38%) |
5.07 |
5.03 - 5.20 |
1.3447 times |
Fri 26 September 2025 |
5.04 (-1.56%) |
5.12 |
4.98 - 5.17 |
1.2103 times |
Fri 19 September 2025 |
5.12 (-0.58%) |
5.17 |
5.11 - 5.28 |
1.3136 times |
Fri 12 September 2025 |
5.15 (1.78%) |
5.06 |
5.03 - 5.18 |
1.2044 times |
Fri 05 September 2025 |
5.06 (-0.2%) |
5.04 |
4.91 - 5.07 |
0.9976 times |
Fri 29 August 2025 |
5.07 (0%) |
4.99 |
4.95 - 5.07 |
0.3657 times |
Fri 29 August 2025 |
5.07 (2.01%) |
4.98 |
4.92 - 5.07 |
1.1594 times |
Fri 22 August 2025 |
4.97 (1.22%) |
4.94 |
4.85 - 4.99 |
1.3898 times |
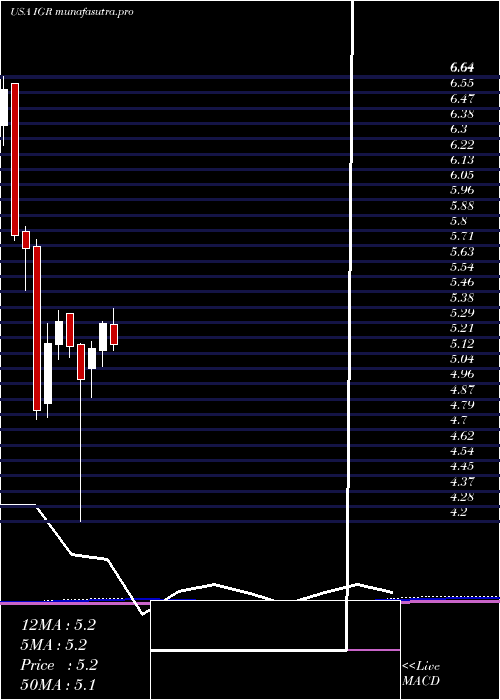
Monthly price and charts CbreClarion Strong monthly Stock price targets for CbreClarion IGR are 4.84 and 5.09 | Monthly Target 1 | 4.79 | | Monthly Target 2 | 4.88 | | Monthly Target 3 | 5.04 | | Monthly Target 4 | 5.13 | | Monthly Target 5 | 5.29 |
Monthly price and volumes Cbre Clarion
| Date |
Closing |
Open |
Range |
Volume |
Mon 20 October 2025 |
4.97 (-3.31%) |
5.15 |
4.95 - 5.20 |
0.4875 times |
Tue 30 September 2025 |
5.14 (1.38%) |
5.04 |
4.91 - 5.28 |
0.8617 times |
Fri 29 August 2025 |
5.07 (4.75%) |
4.85 |
4.77 - 5.07 |
0.9514 times |
Thu 31 July 2025 |
4.84 (-8.51%) |
5.28 |
4.84 - 5.37 |
1.4518 times |
Mon 30 June 2025 |
5.29 (2.72%) |
5.14 |
5.05 - 5.30 |
0.5647 times |
Fri 30 May 2025 |
5.15 (3.41%) |
5.04 |
4.88 - 5.19 |
0.7655 times |
Wed 30 April 2025 |
4.98 (-3.49%) |
5.17 |
4.20 - 5.18 |
1.1989 times |
Mon 31 March 2025 |
5.16 (-2.64%) |
5.34 |
5.10 - 5.34 |
0.9423 times |
Fri 28 February 2025 |
5.30 (2.32%) |
5.17 |
5.09 - 5.36 |
1.2675 times |
Fri 31 January 2025 |
5.18 (7.69%) |
4.85 |
4.77 - 5.29 |
1.5086 times |
Tue 31 December 2024 |
4.81 (-15.61%) |
5.71 |
4.76 - 5.75 |
1.3826 times |
DMA SMA EMA moving averages of Cbre Clarion IGR
DMA (daily moving average) of Cbre Clarion IGR
| DMA period | DMA value | | 5 day DMA | 5.01 | | 12 day DMA | 5.08 | | 20 day DMA | 5.09 | | 35 day DMA | 5.08 | | 50 day DMA | 5.04 | | 100 day DMA | 5.08 | | 150 day DMA | 5.04 | | 200 day DMA | 5.06 | EMA (exponential moving average) of Cbre Clarion IGR
| EMA period | EMA current | EMA prev | EMA prev2 | | 5 day EMA | 5.02 | 5.04 | 5.04 | | 12 day EMA | 5.05 | 5.06 | 5.07 | | 20 day EMA | 5.07 | 5.08 | 5.08 | | 35 day EMA | 5.05 | 5.06 | 5.06 | | 50 day EMA | 5.02 | 5.02 | 5.02 |
SMA (simple moving average) of Cbre Clarion IGR
| SMA period | SMA current | SMA prev | SMA prev2 | | 5 day SMA | 5.01 | 5.01 | 5.03 | | 12 day SMA | 5.08 | 5.09 | 5.09 | | 20 day SMA | 5.09 | 5.1 | 5.11 | | 35 day SMA | 5.08 | 5.08 | 5.08 | | 50 day SMA | 5.04 | 5.03 | 5.03 | | 100 day SMA | 5.08 | 5.08 | 5.08 | | 150 day SMA | 5.04 | 5.04 | 5.04 | | 200 day SMA | 5.06 | 5.06 | 5.06 |
|
|
