IdtCorporation IDT full analysis,charts,indicators,moving averages,SMA,DMA,EMA,ADX,MACD,RSIIdt Corporation IDT WideScreen charts, DMA,SMA,EMA technical analysis, forecast prediction, by indicators ADX,MACD,RSI,CCI USA stock exchange
operates under Public Utilities sector & deals in Telecommunications Equipment
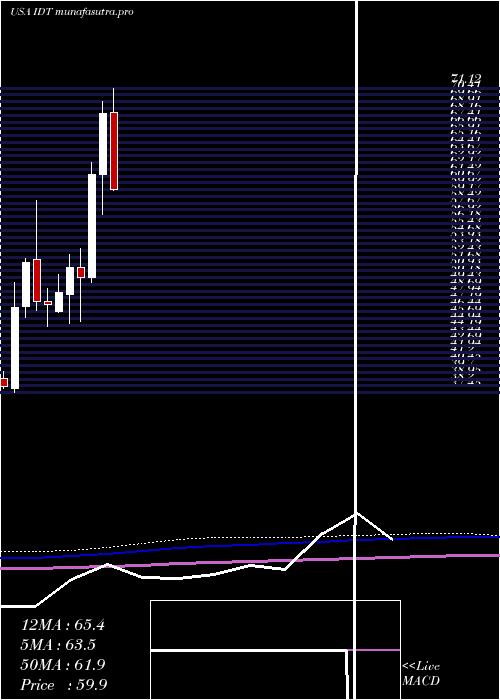
Daily price and charts and targets IdtCorporation Strong Daily Stock price targets for IdtCorporation IDT are 49.83 and 51.39 | Daily Target 1 | 48.6 | | Daily Target 2 | 49.5 | | Daily Target 3 | 50.163333333333 | | Daily Target 4 | 51.06 | | Daily Target 5 | 51.72 |
Daily price and volume Idt Corporation
| Date |
Closing |
Open |
Range |
Volume |
Thu 04 December 2025 |
50.39 (0.68%) |
49.98 |
49.27 - 50.83 |
1.1937 times |
Wed 03 December 2025 |
50.05 (2.1%) |
49.20 |
48.96 - 50.26 |
1.032 times |
Tue 02 December 2025 |
49.02 (-2.02%) |
50.01 |
49.00 - 50.01 |
0.8912 times |
Mon 01 December 2025 |
50.03 (0.52%) |
49.50 |
49.48 - 50.36 |
1.0534 times |
Fri 28 November 2025 |
49.77 (-0.84%) |
50.54 |
49.45 - 50.54 |
0.4806 times |
Wed 26 November 2025 |
50.19 (0.22%) |
49.82 |
49.36 - 50.44 |
1.0501 times |
Tue 25 November 2025 |
50.08 (1.87%) |
49.51 |
49.42 - 50.40 |
1.0641 times |
Mon 24 November 2025 |
49.16 (-1.27%) |
49.84 |
48.97 - 49.84 |
1.2739 times |
Fri 21 November 2025 |
49.79 (3.82%) |
48.33 |
47.90 - 49.80 |
1.041 times |
Thu 20 November 2025 |
47.96 (-1.48%) |
48.81 |
47.96 - 49.58 |
0.92 times |
Wed 19 November 2025 |
48.68 (-2.58%) |
49.75 |
48.57 - 50.14 |
1.0805 times |
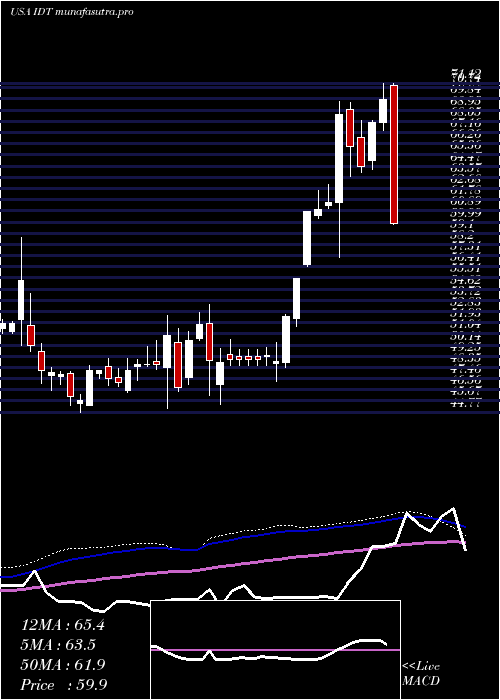
Weekly price and charts IdtCorporation Strong weekly Stock price targets for IdtCorporation IDT are 49.68 and 51.55 | Weekly Target 1 | 48.19 | | Weekly Target 2 | 49.29 | | Weekly Target 3 | 50.06 | | Weekly Target 4 | 51.16 | | Weekly Target 5 | 51.93 |
Weekly price and volumes for Idt Corporation
| Date |
Closing |
Open |
Range |
Volume |
Thu 04 December 2025 |
50.39 (1.25%) |
49.50 |
48.96 - 50.83 |
0.8026 times |
Fri 28 November 2025 |
49.77 (-0.04%) |
49.84 |
48.97 - 50.54 |
0.7445 times |
Fri 21 November 2025 |
49.79 (-3.73%) |
51.77 |
47.90 - 52.45 |
1.1071 times |
Fri 14 November 2025 |
51.72 (2.4%) |
50.59 |
50.55 - 52.68 |
1.0573 times |
Fri 07 November 2025 |
50.51 (-0.3%) |
51.10 |
50.12 - 51.45 |
0.8175 times |
Fri 31 October 2025 |
50.66 (0%) |
50.55 |
50.23 - 51.04 |
0.21 times |
Fri 31 October 2025 |
50.66 (-0.04%) |
51.00 |
50.23 - 51.56 |
1.3058 times |
Fri 24 October 2025 |
50.68 (6.11%) |
47.76 |
47.75 - 50.92 |
1.2835 times |
Fri 17 October 2025 |
47.76 (-0.08%) |
46.40 |
45.72 - 48.56 |
1.7328 times |
Tue 07 October 2025 |
47.80 (-3.55%) |
49.95 |
47.58 - 49.95 |
0.9388 times |
Fri 03 October 2025 |
49.56 (-20.79%) |
62.78 |
48.88 - 64.47 |
3.1305 times |
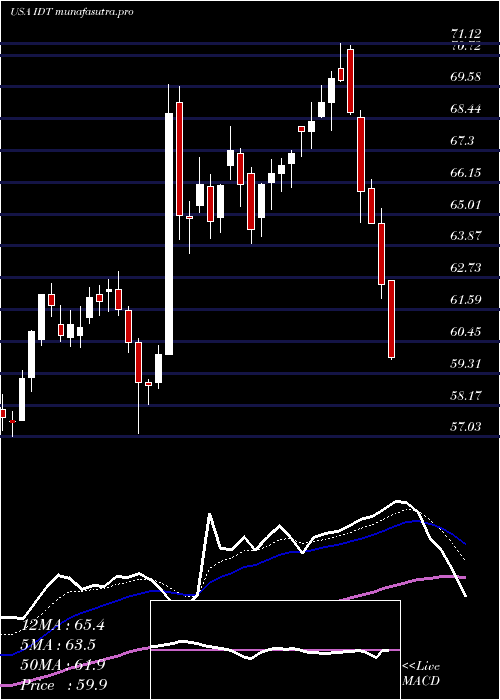
Monthly price and charts IdtCorporation Strong monthly Stock price targets for IdtCorporation IDT are 49.68 and 51.55 | Monthly Target 1 | 48.19 | | Monthly Target 2 | 49.29 | | Monthly Target 3 | 50.06 | | Monthly Target 4 | 51.16 | | Monthly Target 5 | 51.93 |
Monthly price and volumes Idt Corporation
| Date |
Closing |
Open |
Range |
Volume |
Thu 04 December 2025 |
50.39 (1.25%) |
49.50 |
48.96 - 50.83 |
0.1547 times |
Fri 28 November 2025 |
49.77 (-1.76%) |
51.10 |
47.90 - 52.68 |
0.7185 times |
Fri 31 October 2025 |
50.66 (-3.15%) |
52.34 |
45.72 - 53.06 |
1.3655 times |
Tue 30 September 2025 |
52.31 (-18.35%) |
63.71 |
52.00 - 69.15 |
1.4762 times |
Fri 29 August 2025 |
64.07 (8.76%) |
58.80 |
56.53 - 65.15 |
0.8492 times |
Thu 31 July 2025 |
58.91 (-13.77%) |
68.50 |
55.81 - 71.12 |
1.2697 times |
Mon 30 June 2025 |
68.32 (10.93%) |
61.57 |
57.15 - 69.67 |
1.7217 times |
Fri 30 May 2025 |
61.59 (22.57%) |
50.25 |
49.67 - 62.97 |
0.922 times |
Wed 30 April 2025 |
50.25 (-2.07%) |
51.31 |
45.35 - 53.42 |
0.6322 times |
Mon 31 March 2025 |
51.31 (5.66%) |
48.33 |
45.07 - 52.71 |
0.8903 times |
Fri 28 February 2025 |
48.56 (2.92%) |
46.48 |
46.37 - 50.50 |
0.3548 times |
DMA SMA EMA moving averages of Idt Corporation IDT
DMA (daily moving average) of Idt Corporation IDT
| DMA period | DMA value | | 5 day DMA | 49.85 | | 12 day DMA | 49.59 | | 20 day DMA | 50.34 | | 35 day DMA | 50.21 | | 50 day DMA | 51.66 | | 100 day DMA | 56.7 | | 150 day DMA | 58.28 | | 200 day DMA | 56.01 | EMA (exponential moving average) of Idt Corporation IDT
| EMA period | EMA current | EMA prev | EMA prev2 | | 5 day EMA | 49.96 | 49.74 | 49.59 | | 12 day EMA | 49.98 | 49.91 | 49.88 | | 20 day EMA | 50.33 | 50.32 | 50.35 | | 35 day EMA | 51.57 | 51.64 | 51.73 | | 50 day EMA | 52.72 | 52.82 | 52.93 |
SMA (simple moving average) of Idt Corporation IDT
| SMA period | SMA current | SMA prev | SMA prev2 | | 5 day SMA | 49.85 | 49.81 | 49.82 | | 12 day SMA | 49.59 | 49.66 | 49.8 | | 20 day SMA | 50.34 | 50.39 | 50.42 | | 35 day SMA | 50.21 | 50.14 | 50.06 | | 50 day SMA | 51.66 | 51.99 | 52.34 | | 100 day SMA | 56.7 | 56.82 | 56.97 | | 150 day SMA | 58.28 | 58.27 | 58.27 | | 200 day SMA | 56.01 | 56 | 55.99 |
|
|
