IdacorpInc IDA full analysis,charts,indicators,moving averages,SMA,DMA,EMA,ADX,MACD,RSIIdacorp Inc IDA WideScreen charts, DMA,SMA,EMA technical analysis, forecast prediction, by indicators ADX,MACD,RSI,CCI USA stock exchange
operates under Public Utilities sector & deals in Electric Utilities Central
Daily price and charts and targets IdacorpInc Strong Daily Stock price targets for IdacorpInc IDA are 124.95 and 127.59 | Daily Target 1 | 124.44 | | Daily Target 2 | 125.45 | | Daily Target 3 | 127.07666666667 | | Daily Target 4 | 128.09 | | Daily Target 5 | 129.72 |
Daily price and volume Idacorp Inc
| Date |
Closing |
Open |
Range |
Volume |
Thu 04 December 2025 |
126.47 (-1.27%) |
127.51 |
126.06 - 128.70 |
1.1704 times |
Wed 03 December 2025 |
128.10 (-0.19%) |
128.56 |
126.58 - 128.56 |
1.11 times |
Tue 02 December 2025 |
128.35 (-1.51%) |
130.68 |
127.30 - 131.60 |
2.0609 times |
Mon 01 December 2025 |
130.32 (-1.11%) |
130.29 |
130.12 - 132.07 |
1.579 times |
Fri 28 November 2025 |
131.78 (0.73%) |
130.57 |
130.57 - 132.19 |
0.3999 times |
Wed 26 November 2025 |
130.83 (1%) |
130.16 |
130.16 - 131.41 |
0.5788 times |
Tue 25 November 2025 |
129.53 (0.37%) |
129.62 |
128.19 - 130.35 |
0.8846 times |
Mon 24 November 2025 |
129.05 (0.87%) |
128.18 |
126.60 - 129.39 |
0.7096 times |
Fri 21 November 2025 |
127.94 (0.92%) |
127.06 |
126.60 - 128.82 |
0.8042 times |
Thu 20 November 2025 |
126.77 (0.43%) |
127.06 |
126.10 - 127.58 |
0.7027 times |
Wed 19 November 2025 |
126.23 (-0.68%) |
127.66 |
125.83 - 127.66 |
0.6166 times |
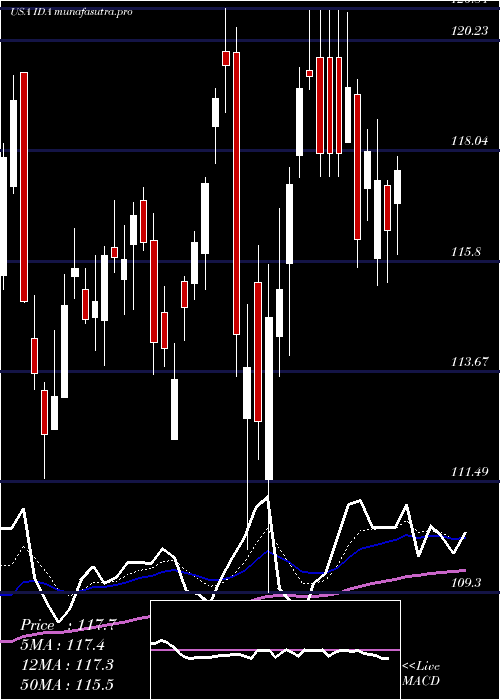
Weekly price and charts IdacorpInc Strong weekly Stock price targets for IdacorpInc IDA are 123.26 and 129.27 | Weekly Target 1 | 122.19 | | Weekly Target 2 | 124.33 | | Weekly Target 3 | 128.2 | | Weekly Target 4 | 130.34 | | Weekly Target 5 | 134.21 |
Weekly price and volumes for Idacorp Inc
| Date |
Closing |
Open |
Range |
Volume |
Thu 04 December 2025 |
126.47 (-4.03%) |
130.29 |
126.06 - 132.07 |
1.6858 times |
Fri 28 November 2025 |
131.78 (3%) |
128.18 |
126.60 - 132.19 |
0.7326 times |
Fri 21 November 2025 |
127.94 (-0.27%) |
128.64 |
125.83 - 129.59 |
0.9583 times |
Fri 14 November 2025 |
128.29 (-0.89%) |
129.58 |
127.54 - 130.91 |
1.1667 times |
Fri 07 November 2025 |
129.44 (0.33%) |
130.10 |
127.52 - 131.14 |
1.067 times |
Fri 31 October 2025 |
129.02 (0%) |
130.05 |
128.20 - 130.96 |
0.3417 times |
Fri 31 October 2025 |
129.02 (-4.49%) |
135.84 |
128.20 - 137.04 |
1.3249 times |
Fri 24 October 2025 |
135.08 (-0.58%) |
136.83 |
133.10 - 138.03 |
1.3461 times |
Fri 17 October 2025 |
135.87 (1.62%) |
134.20 |
133.91 - 137.17 |
0.9613 times |
Tue 07 October 2025 |
133.70 (0.99%) |
132.01 |
132.01 - 134.81 |
0.4156 times |
Fri 03 October 2025 |
132.39 (2.03%) |
130.20 |
129.05 - 134.35 |
1.7632 times |
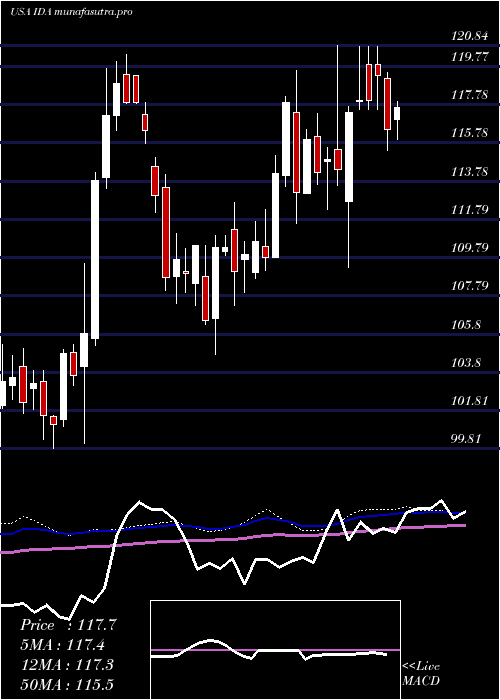
Monthly price and charts IdacorpInc Strong monthly Stock price targets for IdacorpInc IDA are 123.26 and 129.27 | Monthly Target 1 | 122.19 | | Monthly Target 2 | 124.33 | | Monthly Target 3 | 128.2 | | Monthly Target 4 | 130.34 | | Monthly Target 5 | 134.21 |
Monthly price and volumes Idacorp Inc
| Date |
Closing |
Open |
Range |
Volume |
Thu 04 December 2025 |
126.47 (-4.03%) |
130.29 |
126.06 - 132.07 |
0.3376 times |
Fri 28 November 2025 |
131.78 (2.14%) |
130.10 |
125.83 - 132.19 |
0.786 times |
Fri 31 October 2025 |
129.02 (-2.37%) |
132.41 |
128.20 - 138.03 |
1.0989 times |
Tue 30 September 2025 |
132.15 (5.64%) |
124.66 |
122.30 - 132.30 |
0.9707 times |
Fri 29 August 2025 |
125.10 (-0.18%) |
126.33 |
123.91 - 128.50 |
0.888 times |
Thu 31 July 2025 |
125.33 (8.56%) |
115.49 |
113.99 - 125.97 |
1.3564 times |
Mon 30 June 2025 |
115.45 (-2.94%) |
117.62 |
111.12 - 118.70 |
1.1634 times |
Fri 30 May 2025 |
118.95 (0.73%) |
119.80 |
108.15 - 120.00 |
1.6403 times |
Wed 30 April 2025 |
118.09 (1.61%) |
116.00 |
109.30 - 120.84 |
0.9876 times |
Mon 31 March 2025 |
116.22 (-1.43%) |
117.34 |
111.56 - 119.58 |
0.771 times |
Fri 28 February 2025 |
117.91 (7.25%) |
109.02 |
108.68 - 118.19 |
0.7288 times |

DMA SMA EMA moving averages of Idacorp Inc IDA
DMA (daily moving average) of Idacorp Inc IDA
| DMA period | DMA value | | 5 day DMA | 129 | | 12 day DMA | 128.54 | | 20 day DMA | 128.67 | | 35 day DMA | 130.75 | | 50 day DMA | 130.95 | | 100 day DMA | 127.55 | | 150 day DMA | 123.56 | | 200 day DMA | 121.53 | EMA (exponential moving average) of Idacorp Inc IDA
| EMA period | EMA current | EMA prev | EMA prev2 | | 5 day EMA | 128.21 | 129.08 | 129.57 | | 12 day EMA | 128.75 | 129.16 | 129.35 | | 20 day EMA | 129.09 | 129.37 | 129.5 | | 35 day EMA | 129.55 | 129.73 | 129.83 | | 50 day EMA | 130.27 | 130.43 | 130.53 |
SMA (simple moving average) of Idacorp Inc IDA
| SMA period | SMA current | SMA prev | SMA prev2 | | 5 day SMA | 129 | 129.88 | 130.16 | | 12 day SMA | 128.54 | 128.65 | 128.67 | | 20 day SMA | 128.67 | 128.77 | 128.84 | | 35 day SMA | 130.75 | 131.02 | 131.23 | | 50 day SMA | 130.95 | 130.93 | 130.88 | | 100 day SMA | 127.55 | 127.46 | 127.35 | | 150 day SMA | 123.56 | 123.49 | 123.42 | | 200 day SMA | 121.53 | 121.46 | 121.37 |
|
|
