IcuMedical ICUI full analysis,charts,indicators,moving averages,SMA,DMA,EMA,ADX,MACD,RSIIcu Medical ICUI WideScreen charts, DMA,SMA,EMA technical analysis, forecast prediction, by indicators ADX,MACD,RSI,CCI USA stock exchange
operates under Health Care sector & deals in Medical Dental Instruments
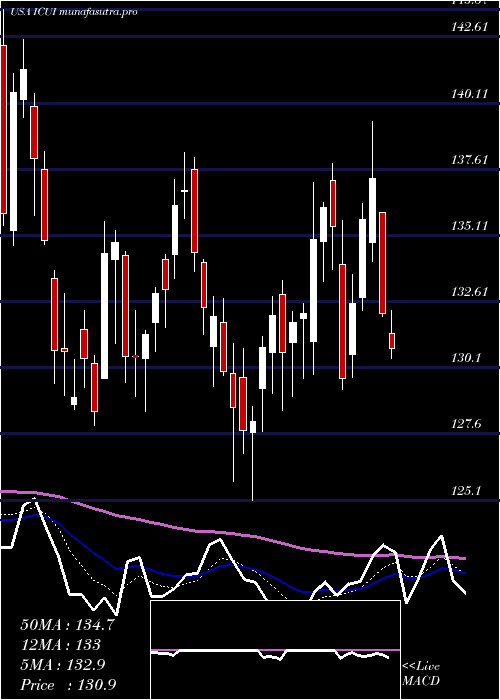
Daily price and charts and targets IcuMedical Strong Daily Stock price targets for IcuMedical ICUI are 140.09 and 143.66 | Daily Target 1 | 139.33 | | Daily Target 2 | 140.84 | | Daily Target 3 | 142.9 | | Daily Target 4 | 144.41 | | Daily Target 5 | 146.47 |
Daily price and volume Icu Medical
| Date |
Closing |
Open |
Range |
Volume |
Thu 04 December 2025 |
142.35 (-1.17%) |
144.96 |
141.39 - 144.96 |
1.157 times |
Wed 03 December 2025 |
144.04 (-1.79%) |
147.37 |
143.59 - 148.12 |
0.734 times |
Tue 02 December 2025 |
146.66 (0.3%) |
147.49 |
143.41 - 148.13 |
0.781 times |
Mon 01 December 2025 |
146.22 (-1.5%) |
147.23 |
145.94 - 150.38 |
0.7234 times |
Fri 28 November 2025 |
148.44 (-0.47%) |
149.14 |
147.37 - 149.69 |
0.3934 times |
Wed 26 November 2025 |
149.14 (-1.82%) |
150.45 |
149.00 - 152.15 |
0.9316 times |
Tue 25 November 2025 |
151.90 (2.26%) |
149.06 |
147.09 - 153.63 |
1.1498 times |
Mon 24 November 2025 |
148.54 (4.36%) |
142.08 |
137.32 - 150.38 |
1.5151 times |
Fri 21 November 2025 |
142.34 (5.96%) |
134.72 |
134.71 - 144.51 |
1.4487 times |
Thu 20 November 2025 |
134.33 (1.33%) |
134.69 |
131.99 - 135.38 |
1.1661 times |
Wed 19 November 2025 |
132.57 (-1.09%) |
133.83 |
132.29 - 134.72 |
0.6452 times |
Weekly price and charts IcuMedical Strong weekly Stock price targets for IcuMedical ICUI are 137.38 and 146.37 | Weekly Target 1 | 135.72 | | Weekly Target 2 | 139.03 | | Weekly Target 3 | 144.70666666667 | | Weekly Target 4 | 148.02 | | Weekly Target 5 | 153.7 |
Weekly price and volumes for Icu Medical
| Date |
Closing |
Open |
Range |
Volume |
Thu 04 December 2025 |
142.35 (-4.1%) |
147.23 |
141.39 - 150.38 |
0.7849 times |
Fri 28 November 2025 |
148.44 (4.29%) |
142.08 |
137.32 - 153.63 |
0.9223 times |
Fri 21 November 2025 |
142.34 (4.28%) |
135.71 |
131.99 - 144.51 |
1.1077 times |
Fri 14 November 2025 |
136.50 (-2.61%) |
139.64 |
134.24 - 144.85 |
1.2824 times |
Fri 07 November 2025 |
140.16 (16.71%) |
122.53 |
119.57 - 149.48 |
1.7659 times |
Fri 31 October 2025 |
120.09 (0%) |
119.34 |
115.00 - 120.43 |
0.2012 times |
Fri 31 October 2025 |
120.09 (-2.75%) |
123.69 |
115.00 - 125.00 |
1.0988 times |
Fri 24 October 2025 |
123.48 (4.24%) |
119.45 |
116.00 - 124.17 |
0.7846 times |
Fri 17 October 2025 |
118.46 (3.79%) |
115.09 |
113.59 - 119.66 |
1.1496 times |
Fri 10 October 2025 |
114.13 (-6.5%) |
122.27 |
112.50 - 122.99 |
0.9026 times |
Fri 03 October 2025 |
122.07 (2.74%) |
119.84 |
115.55 - 125.00 |
0.8574 times |
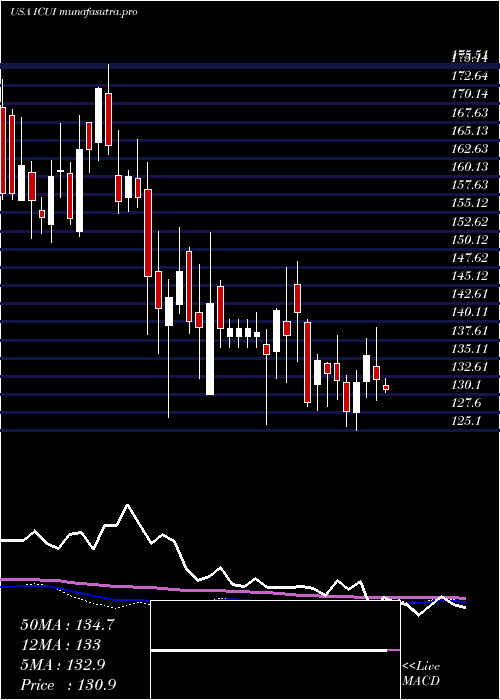
Monthly price and charts IcuMedical Strong monthly Stock price targets for IcuMedical ICUI are 137.38 and 146.37 | Monthly Target 1 | 135.72 | | Monthly Target 2 | 139.03 | | Monthly Target 3 | 144.70666666667 | | Monthly Target 4 | 148.02 | | Monthly Target 5 | 153.7 |
Monthly price and volumes Icu Medical
| Date |
Closing |
Open |
Range |
Volume |
Thu 04 December 2025 |
142.35 (-4.1%) |
147.23 |
141.39 - 150.38 |
0.1689 times |
Fri 28 November 2025 |
148.44 (23.61%) |
122.53 |
119.57 - 153.63 |
1.0927 times |
Fri 31 October 2025 |
120.09 (0.11%) |
119.67 |
112.50 - 125.00 |
0.9945 times |
Tue 30 September 2025 |
119.96 (-6.03%) |
125.27 |
114.70 - 136.61 |
1.1799 times |
Fri 29 August 2025 |
127.66 (-0.58%) |
127.51 |
107.00 - 132.54 |
1.5401 times |
Thu 31 July 2025 |
128.41 (-2.83%) |
131.11 |
121.38 - 139.41 |
0.7955 times |
Mon 30 June 2025 |
132.15 (-2.01%) |
134.34 |
125.10 - 138.26 |
0.7964 times |
Fri 30 May 2025 |
134.86 (-1.27%) |
139.00 |
127.91 - 148.49 |
1.1366 times |
Wed 30 April 2025 |
136.59 (-1.63%) |
141.87 |
126.00 - 152.42 |
1.2472 times |
Mon 31 March 2025 |
138.86 (-5.1%) |
147.00 |
126.95 - 153.06 |
1.0482 times |
Fri 28 February 2025 |
146.33 (-10.97%) |
160.22 |
138.33 - 166.41 |
0.7499 times |
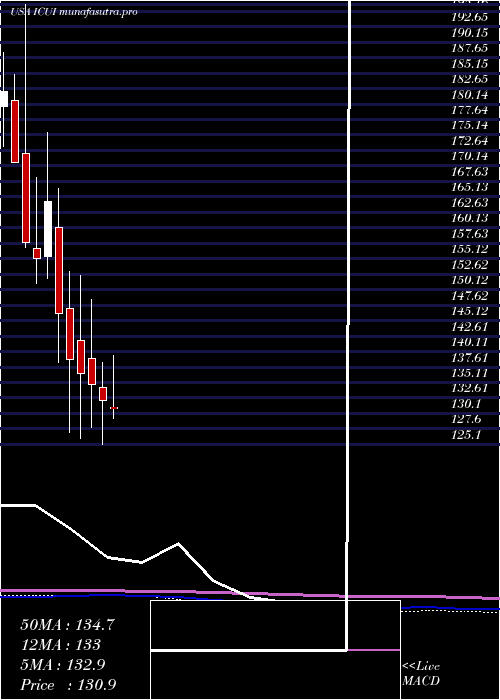
DMA SMA EMA moving averages of Icu Medical ICUI
DMA (daily moving average) of Icu Medical ICUI
| DMA period | DMA value | | 5 day DMA | 145.54 | | 12 day DMA | 143.38 | | 20 day DMA | 141.08 | | 35 day DMA | 132.46 | | 50 day DMA | 128.29 | | 100 day DMA | 127.16 | | 150 day DMA | 129.41 | | 200 day DMA | 132.85 | EMA (exponential moving average) of Icu Medical ICUI
| EMA period | EMA current | EMA prev | EMA prev2 | | 5 day EMA | 144.64 | 145.79 | 146.67 | | 12 day EMA | 143.2 | 143.36 | 143.24 | | 20 day EMA | 140.18 | 139.95 | 139.52 | | 35 day EMA | 135.6 | 135.2 | 134.68 | | 50 day EMA | 130.19 | 129.69 | 129.1 |
SMA (simple moving average) of Icu Medical ICUI
| SMA period | SMA current | SMA prev | SMA prev2 | | 5 day SMA | 145.54 | 146.9 | 148.47 | | 12 day SMA | 143.38 | 142.73 | 142.1 | | 20 day SMA | 141.08 | 140.33 | 139.41 | | 35 day SMA | 132.46 | 131.71 | 130.95 | | 50 day SMA | 128.29 | 127.98 | 127.69 | | 100 day SMA | 127.16 | 127 | 126.87 | | 150 day SMA | 129.41 | 129.37 | 129.33 | | 200 day SMA | 132.85 | 132.95 | 133.03 |
|
|
