IconixBrand ICON full analysis,charts,indicators,moving averages,SMA,DMA,EMA,ADX,MACD,RSIIconix Brand ICON WideScreen charts, DMA,SMA,EMA technical analysis, forecast prediction, by indicators ADX,MACD,RSI,CCI USA stock exchange
operates under Consumer Non Durables sector & deals in Shoe Manufacturing
Daily price and charts and targets IconixBrand Strong Daily Stock price targets for IconixBrand ICON are 0.79 and 0.87 | Daily Target 1 | 0.72 | | Daily Target 2 | 0.78 | | Daily Target 3 | 0.80333333333333 | | Daily Target 4 | 0.86 | | Daily Target 5 | 0.88 |
Daily price and volume Iconix Brand
| Date |
Closing |
Open |
Range |
Volume |
Thu 04 December 2025 |
0.83 (6.41%) |
0.79 |
0.75 - 0.83 |
0.0535 times |
Wed 03 December 2025 |
0.78 (1.3%) |
0.71 |
0.69 - 0.80 |
0.0664 times |
Tue 02 December 2025 |
0.77 (-1.28%) |
0.77 |
0.69 - 0.78 |
0.1009 times |
Mon 01 December 2025 |
0.78 (-2.5%) |
0.79 |
0.73 - 0.79 |
0.1046 times |
Fri 28 November 2025 |
0.80 (-5.88%) |
0.86 |
0.78 - 0.86 |
0.1328 times |
Wed 26 November 2025 |
0.85 (-16.67%) |
0.97 |
0.82 - 1.00 |
0.3513 times |
Tue 25 November 2025 |
1.02 (12.09%) |
1.20 |
0.95 - 1.43 |
9.1137 times |
Mon 24 November 2025 |
0.91 (13.75%) |
0.80 |
0.75 - 0.93 |
0.0181 times |
Fri 21 November 2025 |
0.80 (-11.11%) |
0.70 |
0.70 - 0.87 |
0.0204 times |
Thu 20 November 2025 |
0.90 (-14.29%) |
1.05 |
0.80 - 1.06 |
0.0383 times |
Wed 19 November 2025 |
1.05 (-7.08%) |
1.12 |
1.05 - 1.14 |
0.0048 times |
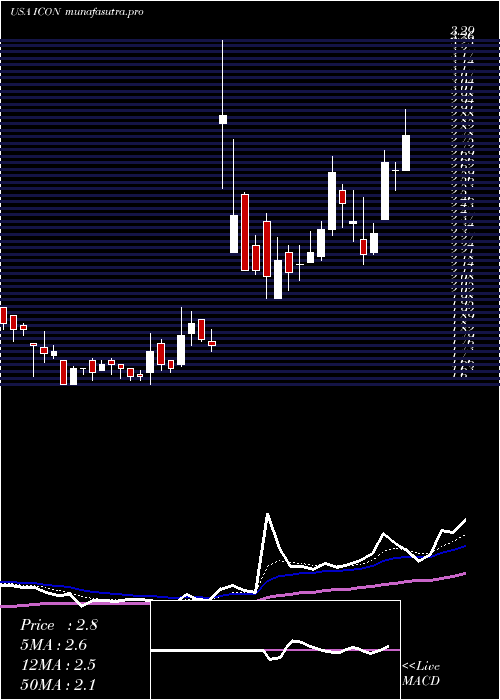
Weekly price and charts IconixBrand Strong weekly Stock price targets for IconixBrand ICON are 0.76 and 0.9 | Weekly Target 1 | 0.64 | | Weekly Target 2 | 0.74 | | Weekly Target 3 | 0.78333333333333 | | Weekly Target 4 | 0.88 | | Weekly Target 5 | 0.92 |
Weekly price and volumes for Iconix Brand
| Date |
Closing |
Open |
Range |
Volume |
Thu 04 December 2025 |
0.83 (3.75%) |
0.79 |
0.69 - 0.83 |
0.3073 times |
Fri 28 November 2025 |
0.80 (0%) |
0.80 |
0.75 - 1.43 |
9.08 times |
Fri 21 November 2025 |
0.80 (-27.93%) |
1.18 |
0.70 - 1.19 |
0.0941 times |
Fri 14 November 2025 |
1.11 (-14.62%) |
1.28 |
1.06 - 1.33 |
0.0806 times |
Fri 07 November 2025 |
1.30 (-19.25%) |
1.45 |
1.12 - 1.45 |
0.0607 times |
Fri 31 October 2025 |
1.61 (0%) |
1.63 |
1.60 - 1.66 |
0.0114 times |
Fri 31 October 2025 |
1.61 (-6.4%) |
1.72 |
1.60 - 1.77 |
0.0569 times |
Fri 24 October 2025 |
1.72 (-2.27%) |
1.76 |
1.62 - 1.86 |
0.0877 times |
Fri 17 October 2025 |
1.76 (-8.33%) |
1.93 |
1.73 - 2.01 |
0.1309 times |
Fri 10 October 2025 |
1.92 (-6.34%) |
2.04 |
1.85 - 2.12 |
0.0903 times |
Fri 03 October 2025 |
2.05 (0.99%) |
2.03 |
2.00 - 2.17 |
0.0761 times |
Monthly price and charts IconixBrand Strong monthly Stock price targets for IconixBrand ICON are 0.76 and 0.9 | Monthly Target 1 | 0.64 | | Monthly Target 2 | 0.74 | | Monthly Target 3 | 0.78333333333333 | | Monthly Target 4 | 0.88 | | Monthly Target 5 | 0.92 |
Monthly price and volumes Iconix Brand
| Date |
Closing |
Open |
Range |
Volume |
Thu 04 December 2025 |
0.83 (3.75%) |
0.79 |
0.69 - 0.83 |
0.0114 times |
Fri 28 November 2025 |
0.80 (-50.31%) |
1.45 |
0.70 - 1.45 |
0.3454 times |
Fri 31 October 2025 |
1.61 (-23.33%) |
2.10 |
1.60 - 2.17 |
0.0163 times |
Tue 30 September 2025 |
2.10 (5%) |
2.00 |
1.87 - 2.37 |
0.0097 times |
Fri 29 August 2025 |
2.00 (-17.36%) |
2.36 |
1.95 - 2.50 |
0.0138 times |
Thu 31 July 2025 |
2.42 (2.54%) |
2.36 |
2.19 - 3.35 |
0.0643 times |
Mon 30 June 2025 |
2.36 (40.48%) |
1.68 |
1.60 - 3.29 |
0.8909 times |
Fri 30 May 2025 |
1.68 (-14.72%) |
2.01 |
1.60 - 2.10 |
0.0207 times |
Wed 30 April 2025 |
1.97 (3840%) |
1.81 |
1.61 - 2.65 |
0.073 times |
Mon 31 March 2025 |
0.05 (-77.27%) |
0.16 |
0.04 - 0.22 |
8.5544 times |
Fri 28 February 2025 |
0.22 (-43.59%) |
0.39 |
0.19 - 0.39 |
1.4918 times |
DMA SMA EMA moving averages of Iconix Brand ICON
DMA (daily moving average) of Iconix Brand ICON
| DMA period | DMA value | | 5 day DMA | 0.79 | | 12 day DMA | 0.89 | | 20 day DMA | 1.01 | | 35 day DMA | 1.29 | | 50 day DMA | 1.52 | | 100 day DMA | 1.93 | | 150 day DMA | 1.97 | | 200 day DMA | 1.73 | EMA (exponential moving average) of Iconix Brand ICON
| EMA period | EMA current | EMA prev | EMA prev2 | | 5 day EMA | 0.82 | 0.81 | 0.82 | | 12 day EMA | 0.91 | 0.92 | 0.94 | | 20 day EMA | 1.03 | 1.05 | 1.08 | | 35 day EMA | 1.27 | 1.3 | 1.33 | | 50 day EMA | 1.51 | 1.54 | 1.57 |
SMA (simple moving average) of Iconix Brand ICON
| SMA period | SMA current | SMA prev | SMA prev2 | | 5 day SMA | 0.79 | 0.8 | 0.84 | | 12 day SMA | 0.89 | 0.91 | 0.94 | | 20 day SMA | 1.01 | 1.03 | 1.06 | | 35 day SMA | 1.29 | 1.32 | 1.36 | | 50 day SMA | 1.52 | 1.55 | 1.58 | | 100 day SMA | 1.93 | 1.94 | 1.96 | | 150 day SMA | 1.97 | 1.97 | 1.98 | | 200 day SMA | 1.73 | 1.73 | 1.73 |
|
|
