IchorHoldings ICHR full analysis,charts,indicators,moving averages,SMA,DMA,EMA,ADX,MACD,RSIIchor Holdings ICHR WideScreen charts, DMA,SMA,EMA technical analysis, forecast prediction, by indicators ADX,MACD,RSI,CCI USA stock exchange
operates under Technology sector & deals in Semiconductors
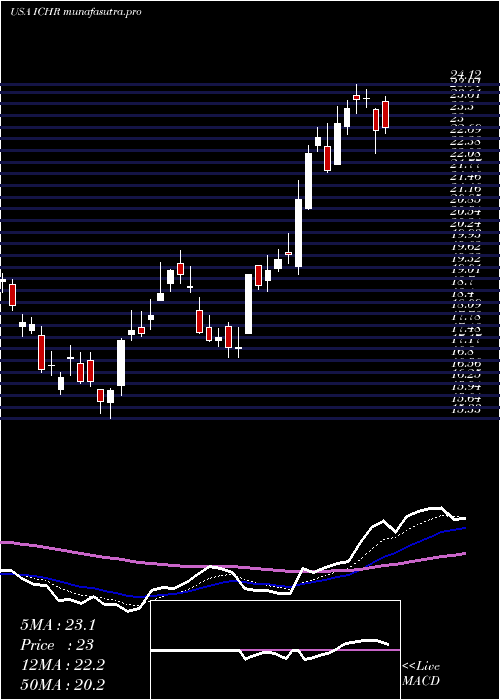
Daily price and charts and targets IchorHoldings Strong Daily Stock price targets for IchorHoldings ICHR are 22.46 and 23.29 | Daily Target 1 | 21.87 | | Daily Target 2 | 22.22 | | Daily Target 3 | 22.696666666667 | | Daily Target 4 | 23.05 | | Daily Target 5 | 23.53 |
Daily price and volume Ichor Holdings
| Date |
Closing |
Open |
Range |
Volume |
Mon 20 October 2025 |
22.58 (2.59%) |
22.41 |
22.34 - 23.17 |
0.9317 times |
Fri 17 October 2025 |
22.01 (-3.17%) |
22.00 |
21.20 - 22.49 |
0.6097 times |
Thu 16 October 2025 |
22.73 (-2.45%) |
23.75 |
22.22 - 23.94 |
1.3843 times |
Wed 15 October 2025 |
23.30 (14.1%) |
21.39 |
21.27 - 23.35 |
1.628 times |
Tue 14 October 2025 |
20.42 (-0.24%) |
19.61 |
19.30 - 20.84 |
0.9115 times |
Mon 13 October 2025 |
20.47 (11.92%) |
19.24 |
19.06 - 20.58 |
0.8766 times |
Fri 10 October 2025 |
18.29 (-8.18%) |
19.97 |
18.24 - 20.08 |
1.1982 times |
Thu 09 October 2025 |
19.92 (1.58%) |
19.61 |
19.25 - 20.14 |
0.7562 times |
Wed 08 October 2025 |
19.61 (4.7%) |
18.85 |
18.74 - 19.66 |
0.7558 times |
Tue 07 October 2025 |
18.73 (-6.82%) |
20.47 |
18.66 - 20.47 |
0.9479 times |
Mon 06 October 2025 |
20.10 (-1.95%) |
20.92 |
20.00 - 21.46 |
0.5846 times |
Weekly price and charts IchorHoldings Strong weekly Stock price targets for IchorHoldings ICHR are 22.46 and 23.29 | Weekly Target 1 | 21.87 | | Weekly Target 2 | 22.22 | | Weekly Target 3 | 22.696666666667 | | Weekly Target 4 | 23.05 | | Weekly Target 5 | 23.53 |
Weekly price and volumes for Ichor Holdings
| Date |
Closing |
Open |
Range |
Volume |
Mon 20 October 2025 |
22.58 (2.59%) |
22.41 |
22.34 - 23.17 |
0.2157 times |
Fri 17 October 2025 |
22.01 (20.34%) |
19.24 |
19.06 - 23.94 |
1.2526 times |
Fri 10 October 2025 |
18.29 (-10.78%) |
20.92 |
18.24 - 21.46 |
0.9823 times |
Fri 03 October 2025 |
20.50 (18.63%) |
17.65 |
17.05 - 21.14 |
1.1173 times |
Fri 26 September 2025 |
17.28 (-6.29%) |
18.47 |
16.52 - 19.75 |
1.4908 times |
Fri 19 September 2025 |
18.44 (9.31%) |
17.07 |
16.33 - 18.73 |
2.0494 times |
Fri 12 September 2025 |
16.87 (-0.06%) |
17.10 |
16.28 - 17.82 |
1.1234 times |
Fri 05 September 2025 |
16.88 (0.18%) |
16.09 |
15.60 - 17.12 |
0.7792 times |
Fri 29 August 2025 |
16.85 (0%) |
17.39 |
16.43 - 17.41 |
0.2009 times |
Fri 29 August 2025 |
16.85 (-7.21%) |
18.06 |
16.43 - 18.21 |
0.7883 times |
Fri 22 August 2025 |
18.16 (1.17%) |
17.97 |
16.39 - 18.85 |
0.8557 times |
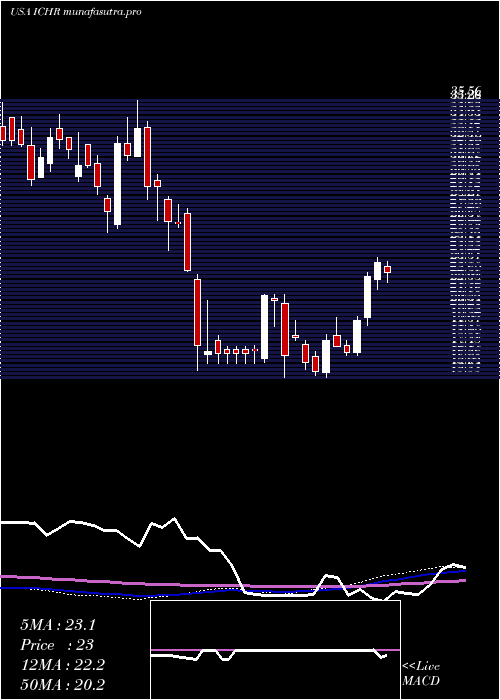
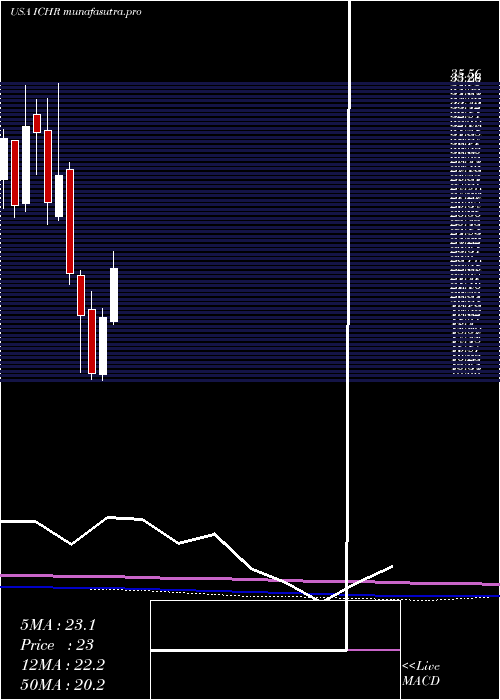
Monthly price and charts IchorHoldings Strong monthly Stock price targets for IchorHoldings ICHR are 19.96 and 26.57 | Monthly Target 1 | 14.67 | | Monthly Target 2 | 18.63 | | Monthly Target 3 | 21.283333333333 | | Monthly Target 4 | 25.24 | | Monthly Target 5 | 27.89 |
Monthly price and volumes Ichor Holdings
| Date |
Closing |
Open |
Range |
Volume |
Mon 20 October 2025 |
22.58 (28.88%) |
17.47 |
17.33 - 23.94 |
1.0603 times |
Tue 30 September 2025 |
17.52 (3.98%) |
16.09 |
15.60 - 19.75 |
1.9021 times |
Fri 29 August 2025 |
16.85 (-14.86%) |
19.20 |
13.12 - 19.59 |
2.3465 times |
Thu 31 July 2025 |
19.79 (0.76%) |
19.33 |
18.75 - 24.12 |
0.7371 times |
Mon 30 June 2025 |
19.64 (24.46%) |
15.75 |
15.33 - 20.21 |
0.7809 times |
Fri 30 May 2025 |
15.78 (-20.22%) |
20.18 |
15.38 - 21.38 |
0.8436 times |
Wed 30 April 2025 |
19.78 (-12.52%) |
22.47 |
15.84 - 22.84 |
0.7172 times |
Mon 31 March 2025 |
22.61 (-22.81%) |
29.69 |
21.88 - 30.16 |
0.5353 times |
Fri 28 February 2025 |
29.29 (6.66%) |
26.50 |
26.19 - 35.56 |
0.6266 times |
Fri 31 January 2025 |
27.46 (-14.77%) |
32.36 |
25.95 - 34.54 |
0.4504 times |
Tue 31 December 2024 |
32.22 (-1.26%) |
33.43 |
29.36 - 34.41 |
0.2976 times |
DMA SMA EMA moving averages of Ichor Holdings ICHR
DMA (daily moving average) of Ichor Holdings ICHR
| DMA period | DMA value | | 5 day DMA | 22.21 | | 12 day DMA | 20.72 | | 20 day DMA | 19.7 | | 35 day DMA | 18.56 | | 50 day DMA | 18.34 | | 100 day DMA | 18.96 | | 150 day DMA | 19.18 | | 200 day DMA | 21.95 | EMA (exponential moving average) of Ichor Holdings ICHR
| EMA period | EMA current | EMA prev | EMA prev2 | | 5 day EMA | 22.01 | 21.72 | 21.58 | | 12 day EMA | 20.94 | 20.64 | 20.39 | | 20 day EMA | 20.16 | 19.9 | 19.68 | | 35 day EMA | 19.25 | 19.05 | 18.88 | | 50 day EMA | 18.52 | 18.35 | 18.2 |
SMA (simple moving average) of Ichor Holdings ICHR
| SMA period | SMA current | SMA prev | SMA prev2 | | 5 day SMA | 22.21 | 21.79 | 21.04 | | 12 day SMA | 20.72 | 20.55 | 20.37 | | 20 day SMA | 19.7 | 19.51 | 19.34 | | 35 day SMA | 18.56 | 18.4 | 18.25 | | 50 day SMA | 18.34 | 18.21 | 18.11 | | 100 day SMA | 18.96 | 18.9 | 18.84 | | 150 day SMA | 19.18 | 19.2 | 19.23 | | 200 day SMA | 21.95 | 22 | 22.05 |
|
|
