ImmucellCorporation ICCC full analysis,charts,indicators,moving averages,SMA,DMA,EMA,ADX,MACD,RSIImmucell Corporation ICCC WideScreen charts, DMA,SMA,EMA technical analysis, forecast prediction, by indicators ADX,MACD,RSI,CCI USA stock exchange
operates under Health Care sector & deals in Biotechnology In Vitro In Vivo Diagnostic Substances
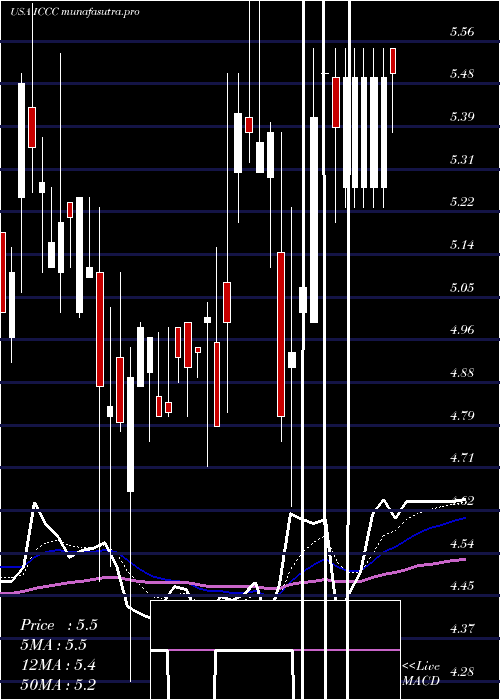
Daily price and charts and targets ImmucellCorporation Strong Daily Stock price targets for ImmucellCorporation ICCC are 4.93 and 5.38 | Daily Target 1 | 4.84 | | Daily Target 2 | 5.02 | | Daily Target 3 | 5.2866666666667 | | Daily Target 4 | 5.47 | | Daily Target 5 | 5.74 |
Daily price and volume Immucell Corporation
| Date |
Closing |
Open |
Range |
Volume |
Thu 04 December 2025 |
5.21 (-0.76%) |
5.33 |
5.10 - 5.55 |
3.0931 times |
Wed 03 December 2025 |
5.25 (5%) |
4.72 |
4.72 - 5.40 |
0.5505 times |
Tue 02 December 2025 |
5.00 (5.49%) |
4.81 |
4.74 - 5.00 |
0.6488 times |
Mon 01 December 2025 |
4.74 (-2.07%) |
4.91 |
4.70 - 4.91 |
0.7667 times |
Fri 28 November 2025 |
4.84 (0.83%) |
4.89 |
4.83 - 5.00 |
0.4718 times |
Wed 26 November 2025 |
4.80 (2.56%) |
4.75 |
4.72 - 5.36 |
1.599 times |
Tue 25 November 2025 |
4.68 (-0.85%) |
4.70 |
4.68 - 4.83 |
0.8585 times |
Mon 24 November 2025 |
4.72 (0.85%) |
4.67 |
4.67 - 4.81 |
0.6553 times |
Fri 21 November 2025 |
4.68 (1.74%) |
4.56 |
4.52 - 4.68 |
0.557 times |
Thu 20 November 2025 |
4.60 (-2.95%) |
4.80 |
4.54 - 4.84 |
0.7995 times |
Wed 19 November 2025 |
4.74 (3.95%) |
4.65 |
4.63 - 4.87 |
0.9895 times |
Weekly price and charts ImmucellCorporation Strong weekly Stock price targets for ImmucellCorporation ICCC are 4.96 and 5.81 | Weekly Target 1 | 4.3 | | Weekly Target 2 | 4.76 | | Weekly Target 3 | 5.1533333333333 | | Weekly Target 4 | 5.61 | | Weekly Target 5 | 6 |
Weekly price and volumes for Immucell Corporation
| Date |
Closing |
Open |
Range |
Volume |
Thu 04 December 2025 |
5.21 (7.64%) |
4.91 |
4.70 - 5.55 |
0.8798 times |
Fri 28 November 2025 |
4.84 (3.42%) |
4.67 |
4.67 - 5.36 |
0.6234 times |
Fri 21 November 2025 |
4.68 (-13.33%) |
5.25 |
4.52 - 5.26 |
1.5636 times |
Fri 14 November 2025 |
5.40 (-11.48%) |
6.02 |
5.40 - 6.36 |
1.2354 times |
Fri 07 November 2025 |
6.10 (-2.24%) |
6.19 |
5.95 - 6.31 |
0.4969 times |
Fri 31 October 2025 |
6.24 (0%) |
6.16 |
6.16 - 6.28 |
0.1299 times |
Fri 31 October 2025 |
6.24 (2.63%) |
6.16 |
5.89 - 6.75 |
1.7517 times |
Fri 24 October 2025 |
6.08 (0.33%) |
6.23 |
6.01 - 6.49 |
0.5949 times |
Fri 17 October 2025 |
6.06 (-10.88%) |
6.80 |
6.06 - 6.99 |
1.42 times |
Fri 10 October 2025 |
6.80 (7.77%) |
6.31 |
6.30 - 6.99 |
1.3043 times |
Fri 03 October 2025 |
6.31 (4.64%) |
5.90 |
5.72 - 6.99 |
2.0023 times |

Monthly price and charts ImmucellCorporation Strong monthly Stock price targets for ImmucellCorporation ICCC are 4.96 and 5.81 | Monthly Target 1 | 4.3 | | Monthly Target 2 | 4.76 | | Monthly Target 3 | 5.1533333333333 | | Monthly Target 4 | 5.61 | | Monthly Target 5 | 6 |
Monthly price and volumes Immucell Corporation
| Date |
Closing |
Open |
Range |
Volume |
Thu 04 December 2025 |
5.21 (7.64%) |
4.91 |
4.70 - 5.55 |
0.189 times |
Fri 28 November 2025 |
4.84 (-22.44%) |
6.19 |
4.52 - 6.36 |
0.8417 times |
Fri 31 October 2025 |
6.24 (-0.16%) |
6.40 |
5.89 - 6.99 |
1.2462 times |
Tue 30 September 2025 |
6.25 (-2.34%) |
6.29 |
5.59 - 7.00 |
0.629 times |
Fri 29 August 2025 |
6.40 (0.47%) |
6.24 |
5.90 - 7.02 |
0.4692 times |
Thu 31 July 2025 |
6.37 (-8.48%) |
6.87 |
6.21 - 7.30 |
0.8041 times |
Mon 30 June 2025 |
6.96 (8.75%) |
6.51 |
5.51 - 7.60 |
2.184 times |
Fri 30 May 2025 |
6.40 (18.08%) |
5.42 |
4.78 - 6.84 |
1.2997 times |
Wed 30 April 2025 |
5.42 (13.15%) |
5.08 |
4.63 - 5.72 |
1.9144 times |
Mon 31 March 2025 |
4.79 (-9.28%) |
5.11 |
4.28 - 5.54 |
0.4227 times |
Fri 28 February 2025 |
5.28 (-2.22%) |
4.95 |
4.84 - 5.64 |
0.2565 times |

DMA SMA EMA moving averages of Immucell Corporation ICCC
DMA (daily moving average) of Immucell Corporation ICCC
| DMA period | DMA value | | 5 day DMA | 5.01 | | 12 day DMA | 4.82 | | 20 day DMA | 5.25 | | 35 day DMA | 5.65 | | 50 day DMA | 5.88 | | 100 day DMA | 6.09 | | 150 day DMA | 6.11 | | 200 day DMA | 5.88 | EMA (exponential moving average) of Immucell Corporation ICCC
| EMA period | EMA current | EMA prev | EMA prev2 | | 5 day EMA | 5.06 | 4.98 | 4.85 | | 12 day EMA | 5.06 | 5.03 | 4.99 | | 20 day EMA | 5.21 | 5.21 | 5.21 | | 35 day EMA | 5.48 | 5.5 | 5.51 | | 50 day EMA | 5.82 | 5.84 | 5.86 |
SMA (simple moving average) of Immucell Corporation ICCC
| SMA period | SMA current | SMA prev | SMA prev2 | | 5 day SMA | 5.01 | 4.93 | 4.81 | | 12 day SMA | 4.82 | 4.79 | 4.81 | | 20 day SMA | 5.25 | 5.31 | 5.35 | | 35 day SMA | 5.65 | 5.69 | 5.72 | | 50 day SMA | 5.88 | 5.9 | 5.92 | | 100 day SMA | 6.09 | 6.1 | 6.12 | | 150 day SMA | 6.11 | 6.12 | 6.12 | | 200 day SMA | 5.88 | 5.88 | 5.88 |
|
|
