InternationalBancshares IBOC full analysis,charts,indicators,moving averages,SMA,DMA,EMA,ADX,MACD,RSIInternational Bancshares IBOC WideScreen charts, DMA,SMA,EMA technical analysis, forecast prediction, by indicators ADX,MACD,RSI,CCI USA stock exchange
operates under Finance sector & deals in Major Banks
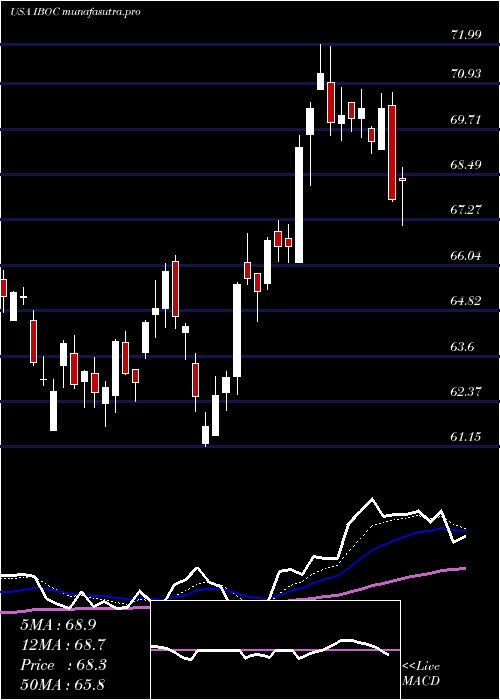
Daily price and charts and targets InternationalBancshares Strong Daily Stock price targets for InternationalBancshares IBOC are 66.09 and 67.54 | Daily Target 1 | 64.91 | | Daily Target 2 | 65.82 | | Daily Target 3 | 66.363333333333 | | Daily Target 4 | 67.27 | | Daily Target 5 | 67.81 |
Daily price and volume International Bancshares
| Date |
Closing |
Open |
Range |
Volume |
Mon 20 October 2025 |
66.72 (1.8%) |
66.10 |
65.46 - 66.91 |
0.7555 times |
Fri 17 October 2025 |
65.54 (1.22%) |
65.27 |
64.29 - 65.77 |
1.015 times |
Thu 16 October 2025 |
64.75 (-4.57%) |
67.65 |
64.18 - 67.93 |
1.6676 times |
Wed 15 October 2025 |
67.85 (-1.06%) |
68.98 |
67.28 - 69.19 |
1.1134 times |
Tue 14 October 2025 |
68.58 (2.63%) |
66.52 |
66.52 - 68.62 |
0.9447 times |
Mon 13 October 2025 |
66.82 (1.63%) |
66.41 |
65.90 - 67.20 |
0.9914 times |
Fri 10 October 2025 |
65.75 (-2.13%) |
67.24 |
65.66 - 68.90 |
1.517 times |
Thu 09 October 2025 |
67.18 (-1.03%) |
67.86 |
66.82 - 67.86 |
0.627 times |
Wed 08 October 2025 |
67.88 (-0.45%) |
68.63 |
67.75 - 68.63 |
0.5165 times |
Tue 07 October 2025 |
68.19 (-1.02%) |
69.05 |
68.13 - 69.26 |
0.8519 times |
Mon 06 October 2025 |
68.89 (0.32%) |
69.14 |
68.37 - 69.75 |
0.9242 times |
Weekly price and charts InternationalBancshares Strong weekly Stock price targets for InternationalBancshares IBOC are 66.09 and 67.54 | Weekly Target 1 | 64.91 | | Weekly Target 2 | 65.82 | | Weekly Target 3 | 66.363333333333 | | Weekly Target 4 | 67.27 | | Weekly Target 5 | 67.81 |
Weekly price and volumes for International Bancshares
| Date |
Closing |
Open |
Range |
Volume |
Mon 20 October 2025 |
66.72 (1.8%) |
66.10 |
65.46 - 66.91 |
0.181 times |
Fri 17 October 2025 |
65.54 (-0.32%) |
66.41 |
64.18 - 69.19 |
1.3736 times |
Fri 10 October 2025 |
65.75 (-4.25%) |
69.14 |
65.66 - 69.75 |
1.0632 times |
Fri 03 October 2025 |
68.67 (-2.05%) |
70.05 |
67.49 - 70.15 |
0.952 times |
Fri 26 September 2025 |
70.11 (0.49%) |
69.58 |
68.31 - 70.31 |
1.0467 times |
Fri 19 September 2025 |
69.77 (-1.18%) |
70.63 |
68.23 - 71.04 |
1.9447 times |
Fri 12 September 2025 |
70.60 (-1.37%) |
71.95 |
70.06 - 71.95 |
0.9479 times |
Fri 05 September 2025 |
71.58 (0.06%) |
70.78 |
70.35 - 73.58 |
0.9276 times |
Fri 29 August 2025 |
71.54 (0%) |
71.79 |
71.34 - 72.17 |
0.3148 times |
Fri 29 August 2025 |
71.54 (-1.13%) |
72.00 |
70.90 - 73.48 |
1.2484 times |
Fri 22 August 2025 |
72.36 (5.98%) |
68.20 |
67.80 - 72.57 |
1.3253 times |
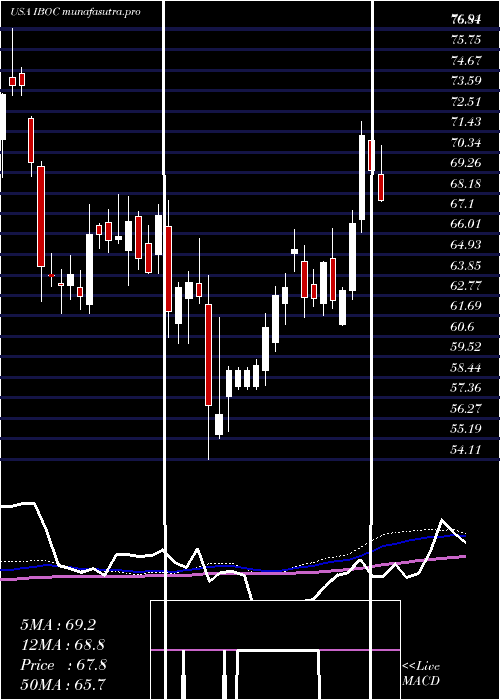
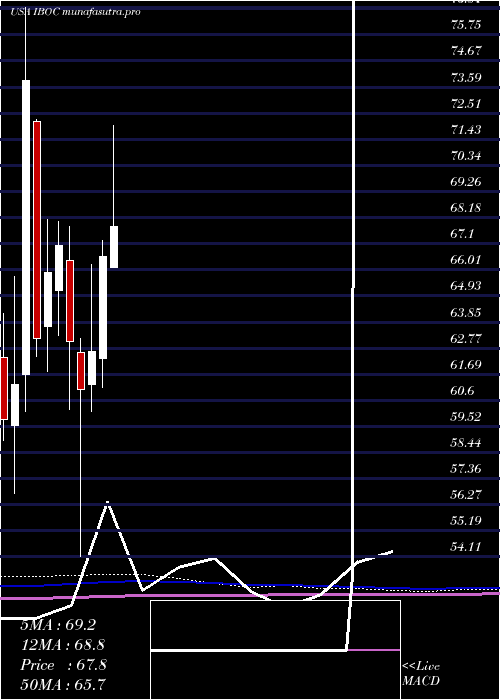
Monthly price and charts InternationalBancshares Strong monthly Stock price targets for InternationalBancshares IBOC are 62.67 and 68.24 | Monthly Target 1 | 61.31 | | Monthly Target 2 | 64.02 | | Monthly Target 3 | 66.883333333333 | | Monthly Target 4 | 69.59 | | Monthly Target 5 | 72.45 |
Monthly price and volumes International Bancshares
| Date |
Closing |
Open |
Range |
Volume |
Mon 20 October 2025 |
66.72 (-2.95%) |
68.43 |
64.18 - 69.75 |
0.5334 times |
Tue 30 September 2025 |
68.75 (-3.9%) |
70.78 |
67.84 - 73.58 |
0.8915 times |
Fri 29 August 2025 |
71.54 (4.93%) |
67.88 |
66.13 - 73.48 |
0.953 times |
Thu 31 July 2025 |
68.18 (2.43%) |
66.12 |
66.12 - 71.99 |
0.9108 times |
Mon 30 June 2025 |
66.56 (6.27%) |
62.33 |
61.15 - 67.25 |
0.8444 times |
Fri 30 May 2025 |
62.63 (2.6%) |
61.24 |
60.14 - 66.24 |
0.7952 times |
Wed 30 April 2025 |
61.04 (-3.2%) |
62.60 |
54.11 - 63.16 |
1.2509 times |
Mon 31 March 2025 |
63.06 (-5.88%) |
66.40 |
60.23 - 67.80 |
1.4434 times |
Fri 28 February 2025 |
67.00 (1.68%) |
65.14 |
63.30 - 68.00 |
1.0636 times |
Fri 31 January 2025 |
65.89 (4.32%) |
63.68 |
61.80 - 68.09 |
1.3138 times |
Tue 31 December 2024 |
63.16 (-14.51%) |
72.14 |
62.44 - 72.25 |
1.0353 times |
DMA SMA EMA moving averages of International Bancshares IBOC
DMA (daily moving average) of International Bancshares IBOC
| DMA period | DMA value | | 5 day DMA | 66.69 | | 12 day DMA | 67.24 | | 20 day DMA | 67.98 | | 35 day DMA | 69.07 | | 50 day DMA | 69.53 | | 100 day DMA | 68.31 | | 150 day DMA | 66.07 | | 200 day DMA | 65.78 | EMA (exponential moving average) of International Bancshares IBOC
| EMA period | EMA current | EMA prev | EMA prev2 | | 5 day EMA | 66.45 | 66.31 | 66.7 | | 12 day EMA | 67.13 | 67.2 | 67.5 | | 20 day EMA | 67.73 | 67.84 | 68.08 | | 35 day EMA | 68.47 | 68.57 | 68.75 | | 50 day EMA | 69.21 | 69.31 | 69.46 |
SMA (simple moving average) of International Bancshares IBOC
| SMA period | SMA current | SMA prev | SMA prev2 | | 5 day SMA | 66.69 | 66.71 | 66.75 | | 12 day SMA | 67.24 | 67.36 | 67.62 | | 20 day SMA | 67.98 | 68.08 | 68.29 | | 35 day SMA | 69.07 | 69.21 | 69.38 | | 50 day SMA | 69.53 | 69.57 | 69.64 | | 100 day SMA | 68.31 | 68.28 | 68.25 | | 150 day SMA | 66.07 | 66.03 | 66.01 | | 200 day SMA | 65.78 | 65.76 | 65.75 |
|
|
