IacInteractivecorp IAC full analysis,charts,indicators,moving averages,SMA,DMA,EMA,ADX,MACD,RSIIac Interactivecorp IAC WideScreen charts, DMA,SMA,EMA technical analysis, forecast prediction, by indicators ADX,MACD,RSI,CCI USA stock exchange
operates under Consumer Services sector & deals in Other Specialty Stores
Daily price and charts and targets IacInteractivecorp Strong Daily Stock price targets for IacInteractivecorp IAC are 33.56 and 34.63 | Daily Target 1 | 32.71 | | Daily Target 2 | 33.34 | | Daily Target 3 | 33.783333333333 | | Daily Target 4 | 34.41 | | Daily Target 5 | 34.85 |
Daily price and volume Iac Interactivecorp
| Date |
Closing |
Open |
Range |
Volume |
Tue 21 October 2025 |
33.96 (1.86%) |
33.22 |
33.16 - 34.23 |
1.5348 times |
Mon 20 October 2025 |
33.34 (1.86%) |
33.15 |
32.91 - 33.47 |
0.6648 times |
Fri 17 October 2025 |
32.73 (-0.37%) |
32.55 |
32.44 - 33.00 |
0.9131 times |
Thu 16 October 2025 |
32.85 (-1.32%) |
33.59 |
32.51 - 33.81 |
1.0803 times |
Wed 15 October 2025 |
33.29 (-0.03%) |
33.58 |
33.07 - 33.69 |
0.8621 times |
Tue 14 October 2025 |
33.30 (1.34%) |
32.40 |
32.27 - 33.51 |
0.8112 times |
Mon 13 October 2025 |
32.86 (2.21%) |
32.63 |
32.18 - 32.89 |
0.8933 times |
Fri 10 October 2025 |
32.15 (-3.77%) |
33.45 |
32.06 - 33.59 |
1.4549 times |
Thu 09 October 2025 |
33.41 (0.24%) |
33.58 |
33.16 - 33.66 |
0.9137 times |
Wed 08 October 2025 |
33.33 (-0.42%) |
33.66 |
33.27 - 33.74 |
0.8717 times |
Tue 07 October 2025 |
33.47 (-2.19%) |
34.17 |
33.44 - 34.22 |
1.2566 times |
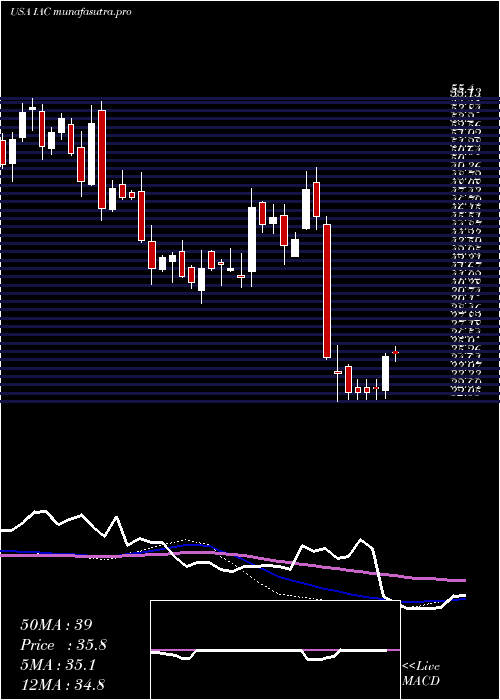
Weekly price and charts IacInteractivecorp Strong weekly Stock price targets for IacInteractivecorp IAC are 33.44 and 34.76 | Weekly Target 1 | 32.38 | | Weekly Target 2 | 33.17 | | Weekly Target 3 | 33.7 | | Weekly Target 4 | 34.49 | | Weekly Target 5 | 35.02 |
Weekly price and volumes for Iac Interactivecorp
| Date |
Closing |
Open |
Range |
Volume |
Tue 21 October 2025 |
33.96 (3.76%) |
33.15 |
32.91 - 34.23 |
0.3777 times |
Fri 17 October 2025 |
32.73 (1.8%) |
32.63 |
32.18 - 33.81 |
0.7831 times |
Fri 10 October 2025 |
32.15 (-7.05%) |
34.60 |
32.06 - 34.61 |
0.9098 times |
Fri 03 October 2025 |
34.59 (-1.28%) |
35.58 |
33.84 - 35.58 |
1.438 times |
Fri 26 September 2025 |
35.04 (-3.28%) |
36.33 |
33.96 - 36.47 |
1.4145 times |
Fri 19 September 2025 |
36.23 (0.44%) |
36.23 |
35.91 - 38.09 |
1.4787 times |
Fri 12 September 2025 |
36.07 (-3.01%) |
37.31 |
35.13 - 37.38 |
1.3096 times |
Fri 05 September 2025 |
37.19 (1.56%) |
36.02 |
35.71 - 38.05 |
1.1121 times |
Fri 29 August 2025 |
36.62 (0%) |
36.67 |
36.48 - 36.89 |
0.1616 times |
Fri 29 August 2025 |
36.62 (0.52%) |
36.33 |
35.00 - 37.10 |
1.0149 times |
Fri 22 August 2025 |
36.43 (2.74%) |
35.26 |
34.70 - 36.86 |
1.3352 times |
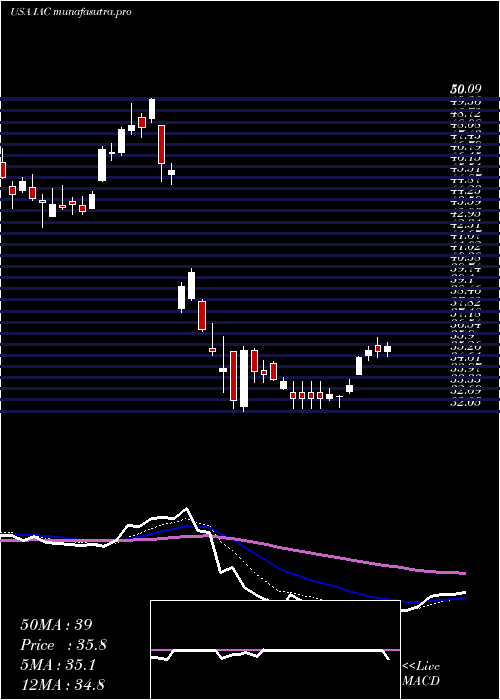
Monthly price and charts IacInteractivecorp Strong monthly Stock price targets for IacInteractivecorp IAC are 33.01 and 36.17 | Monthly Target 1 | 30.59 | | Monthly Target 2 | 32.27 | | Monthly Target 3 | 33.746666666667 | | Monthly Target 4 | 35.43 | | Monthly Target 5 | 36.91 |
Monthly price and volumes Iac Interactivecorp
| Date |
Closing |
Open |
Range |
Volume |
Tue 21 October 2025 |
33.96 (-0.32%) |
33.93 |
32.06 - 35.22 |
0.6318 times |
Tue 30 September 2025 |
34.07 (-6.96%) |
36.02 |
33.84 - 38.09 |
1.2899 times |
Fri 29 August 2025 |
36.62 (-6.82%) |
38.77 |
32.08 - 38.99 |
1.5102 times |
Thu 31 July 2025 |
39.30 (5.25%) |
37.29 |
37.29 - 41.86 |
0.7288 times |
Mon 30 June 2025 |
37.34 (3.84%) |
35.85 |
34.84 - 37.91 |
0.8963 times |
Fri 30 May 2025 |
35.96 (2.92%) |
35.40 |
33.11 - 39.94 |
1.1256 times |
Wed 30 April 2025 |
34.94 (-23.94%) |
37.96 |
32.05 - 40.30 |
1.1373 times |
Mon 31 March 2025 |
45.94 (-0.61%) |
46.36 |
42.61 - 50.09 |
1.0136 times |
Fri 28 February 2025 |
46.22 (9.19%) |
41.75 |
40.86 - 48.50 |
0.9961 times |
Fri 31 January 2025 |
42.33 (-1.88%) |
43.30 |
39.61 - 44.48 |
0.6704 times |
Tue 31 December 2024 |
43.14 (-9.67%) |
48.25 |
41.08 - 49.69 |
0.5991 times |

DMA SMA EMA moving averages of Iac Interactivecorp IAC
DMA (daily moving average) of Iac Interactivecorp IAC
| DMA period | DMA value | | 5 day DMA | 33.23 | | 12 day DMA | 33.24 | | 20 day DMA | 33.77 | | 35 day DMA | 34.88 | | 50 day DMA | 35.2 | | 100 day DMA | 36.57 | | 150 day DMA | 36.9 | | 200 day DMA | 38.58 | EMA (exponential moving average) of Iac Interactivecorp IAC
| EMA period | EMA current | EMA prev | EMA prev2 | | 5 day EMA | 33.38 | 33.09 | 32.96 | | 12 day EMA | 33.48 | 33.39 | 33.4 | | 20 day EMA | 33.83 | 33.82 | 33.87 | | 35 day EMA | 34.31 | 34.33 | 34.39 | | 50 day EMA | 34.94 | 34.98 | 35.05 |
SMA (simple moving average) of Iac Interactivecorp IAC
| SMA period | SMA current | SMA prev | SMA prev2 | | 5 day SMA | 33.23 | 33.1 | 33.01 | | 12 day SMA | 33.24 | 33.3 | 33.38 | | 20 day SMA | 33.77 | 33.81 | 33.91 | | 35 day SMA | 34.88 | 34.96 | 35.05 | | 50 day SMA | 35.2 | 35.2 | 35.21 | | 100 day SMA | 36.57 | 36.59 | 36.63 | | 150 day SMA | 36.9 | 36.97 | 37.04 | | 200 day SMA | 38.58 | 38.62 | 38.67 |
|
|
