MarinemaxInc HZO full analysis,charts,indicators,moving averages,SMA,DMA,EMA,ADX,MACD,RSIMarinemax Inc HZO WideScreen charts, DMA,SMA,EMA technical analysis, forecast prediction, by indicators ADX,MACD,RSI,CCI USA stock exchange
operates under Consumer Services sector & deals in Other Specialty Stores
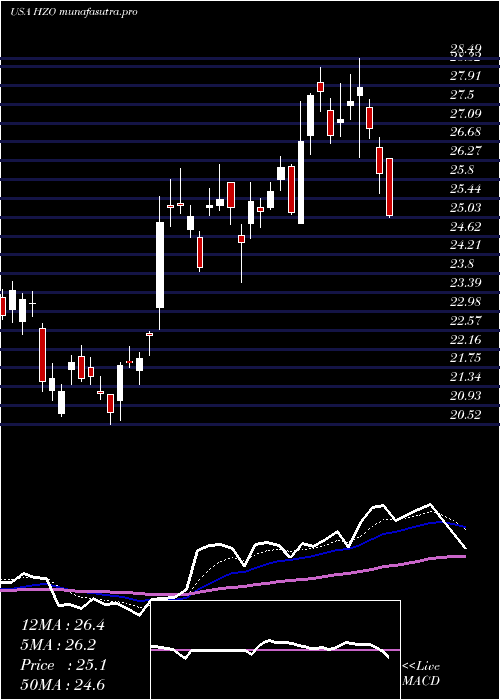
Daily price and charts and targets MarinemaxInc Strong Daily Stock price targets for MarinemaxInc HZO are 23.66 and 24.86 | Daily Target 1 | 22.74 | | Daily Target 2 | 23.37 | | Daily Target 3 | 23.936666666667 | | Daily Target 4 | 24.57 | | Daily Target 5 | 25.14 |
Daily price and volume Marinemax Inc
| Date |
Closing |
Open |
Range |
Volume |
Thu 04 December 2025 |
24.01 (1.48%) |
23.74 |
23.30 - 24.50 |
0.9004 times |
Wed 03 December 2025 |
23.66 (0.72%) |
23.72 |
23.62 - 24.43 |
1.3588 times |
Tue 02 December 2025 |
23.49 (3.12%) |
22.93 |
22.49 - 23.59 |
1.0688 times |
Mon 01 December 2025 |
22.78 (-2.57%) |
23.00 |
22.74 - 23.71 |
0.9849 times |
Fri 28 November 2025 |
23.38 (-2.91%) |
23.96 |
23.26 - 24.53 |
0.4729 times |
Wed 26 November 2025 |
24.08 (-2.47%) |
24.56 |
24.04 - 24.97 |
1.1246 times |
Tue 25 November 2025 |
24.69 (5.69%) |
23.59 |
23.59 - 25.43 |
1.0864 times |
Mon 24 November 2025 |
23.36 (0.39%) |
23.31 |
22.70 - 23.80 |
1.1293 times |
Fri 21 November 2025 |
23.27 (8.59%) |
21.69 |
21.49 - 23.72 |
0.9146 times |
Thu 20 November 2025 |
21.43 (-4.24%) |
22.64 |
21.42 - 22.80 |
0.9593 times |
Wed 19 November 2025 |
22.38 (-1.1%) |
22.89 |
22.26 - 23.10 |
1.0886 times |
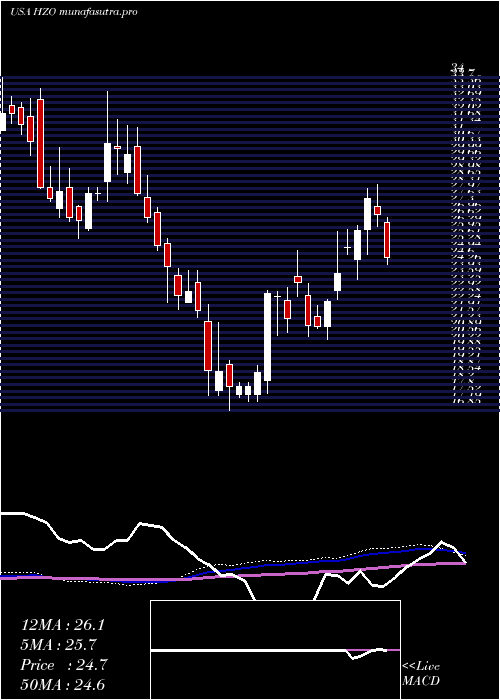
Weekly price and charts MarinemaxInc Strong weekly Stock price targets for MarinemaxInc HZO are 23.25 and 25.26 | Weekly Target 1 | 21.66 | | Weekly Target 2 | 22.83 | | Weekly Target 3 | 23.666666666667 | | Weekly Target 4 | 24.84 | | Weekly Target 5 | 25.68 |
Weekly price and volumes for Marinemax Inc
| Date |
Closing |
Open |
Range |
Volume |
Thu 04 December 2025 |
24.01 (2.69%) |
23.00 |
22.49 - 24.50 |
1.007 times |
Fri 28 November 2025 |
23.38 (0.47%) |
23.31 |
22.70 - 25.43 |
0.8903 times |
Fri 21 November 2025 |
23.27 (0.13%) |
23.25 |
21.42 - 23.79 |
1.2826 times |
Fri 14 November 2025 |
23.24 (-2.23%) |
24.06 |
21.70 - 24.78 |
1.8295 times |
Fri 07 November 2025 |
23.77 (-4.04%) |
24.28 |
23.00 - 25.05 |
1.0646 times |
Fri 31 October 2025 |
24.77 (0%) |
23.42 |
23.28 - 24.87 |
0.2284 times |
Fri 31 October 2025 |
24.77 (-6.6%) |
26.70 |
23.28 - 27.90 |
1.3253 times |
Fri 24 October 2025 |
26.52 (3.92%) |
25.82 |
25.70 - 26.99 |
0.7062 times |
Fri 17 October 2025 |
25.52 (0.08%) |
24.41 |
24.26 - 27.62 |
1.3147 times |
Tue 07 October 2025 |
25.50 (-9.38%) |
28.29 |
25.38 - 28.29 |
0.3513 times |
Fri 03 October 2025 |
28.14 (7.36%) |
26.37 |
24.84 - 28.23 |
1.3942 times |
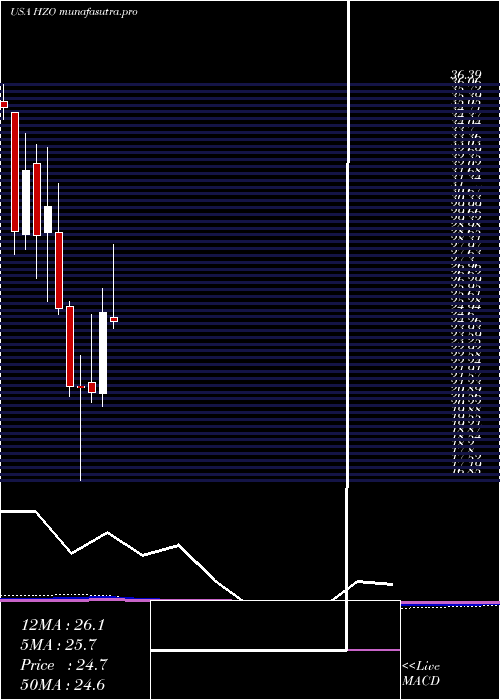
Monthly price and charts MarinemaxInc Strong monthly Stock price targets for MarinemaxInc HZO are 23.25 and 25.26 | Monthly Target 1 | 21.66 | | Monthly Target 2 | 22.83 | | Monthly Target 3 | 23.666666666667 | | Monthly Target 4 | 24.84 | | Monthly Target 5 | 25.68 |
Monthly price and volumes Marinemax Inc
| Date |
Closing |
Open |
Range |
Volume |
Thu 04 December 2025 |
24.01 (2.69%) |
23.00 |
22.49 - 24.50 |
0.2099 times |
Fri 28 November 2025 |
23.38 (-5.61%) |
24.28 |
21.42 - 25.43 |
1.0563 times |
Fri 31 October 2025 |
24.77 (-2.21%) |
25.21 |
23.28 - 28.29 |
0.9913 times |
Tue 30 September 2025 |
25.33 (-3.87%) |
25.80 |
24.71 - 27.73 |
1.1677 times |
Fri 29 August 2025 |
26.35 (16.18%) |
22.23 |
21.41 - 28.35 |
0.9912 times |
Thu 31 July 2025 |
22.68 (-9.79%) |
24.90 |
21.64 - 28.49 |
1.2071 times |
Mon 30 June 2025 |
25.14 (18.58%) |
21.17 |
20.52 - 26.36 |
0.9582 times |
Fri 30 May 2025 |
21.20 (-1.21%) |
21.70 |
20.69 - 25.07 |
0.8872 times |
Wed 30 April 2025 |
21.46 (-0.19%) |
21.51 |
16.85 - 23.01 |
1.5162 times |
Mon 31 March 2025 |
21.50 (-15.19%) |
25.44 |
21.00 - 25.70 |
1.0149 times |
Fri 28 February 2025 |
25.35 (-16.5%) |
29.10 |
25.07 - 31.51 |
0.6629 times |
DMA SMA EMA moving averages of Marinemax Inc HZO
DMA (daily moving average) of Marinemax Inc HZO
| DMA period | DMA value | | 5 day DMA | 23.46 | | 12 day DMA | 23.26 | | 20 day DMA | 23.25 | | 35 day DMA | 24.21 | | 50 day DMA | 24.78 | | 100 day DMA | 25.01 | | 150 day DMA | 24.58 | | 200 day DMA | 24.09 | EMA (exponential moving average) of Marinemax Inc HZO
| EMA period | EMA current | EMA prev | EMA prev2 | | 5 day EMA | 23.65 | 23.47 | 23.37 | | 12 day EMA | 23.5 | 23.41 | 23.36 | | 20 day EMA | 23.63 | 23.59 | 23.58 | | 35 day EMA | 24.09 | 24.1 | 24.13 | | 50 day EMA | 24.74 | 24.77 | 24.82 |
SMA (simple moving average) of Marinemax Inc HZO
| SMA period | SMA current | SMA prev | SMA prev2 | | 5 day SMA | 23.46 | 23.48 | 23.68 | | 12 day SMA | 23.26 | 23.11 | 23.08 | | 20 day SMA | 23.25 | 23.26 | 23.25 | | 35 day SMA | 24.21 | 24.3 | 24.39 | | 50 day SMA | 24.78 | 24.81 | 24.85 | | 100 day SMA | 25.01 | 25.05 | 25.09 | | 150 day SMA | 24.58 | 24.57 | 24.57 | | 200 day SMA | 24.09 | 24.12 | 24.15 |
|
|
