HysterYale HY full analysis,charts,indicators,moving averages,SMA,DMA,EMA,ADX,MACD,RSIHyster Yale HY WideScreen charts, DMA,SMA,EMA technical analysis, forecast prediction, by indicators ADX,MACD,RSI,CCI USA stock exchange
operates under Capital Goods sector & deals in Construction Ag Equipment Trucks
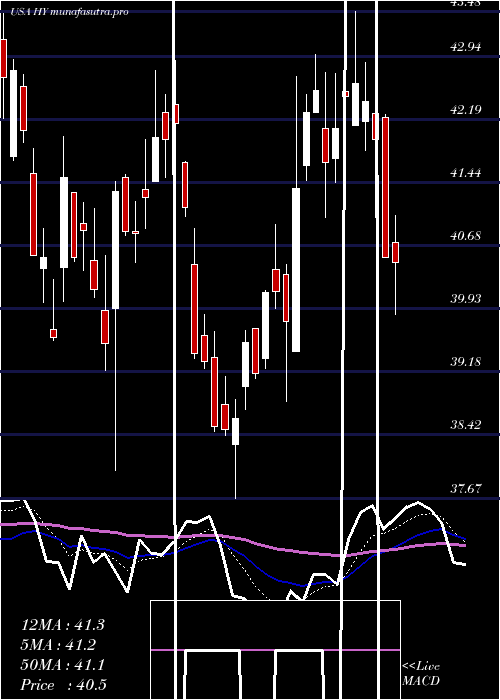
Daily price and charts and targets HysterYale Strong Daily Stock price targets for HysterYale HY are 31.64 and 36.91 | Daily Target 1 | 30.5 | | Daily Target 2 | 32.77 | | Daily Target 3 | 35.773333333333 | | Daily Target 4 | 38.04 | | Daily Target 5 | 41.04 |
Daily price and volume Hyster Yale
| Date |
Closing |
Open |
Range |
Volume |
Thu 04 December 2025 |
35.03 (1.83%) |
38.27 |
33.51 - 38.78 |
2.7257 times |
Wed 03 December 2025 |
34.40 (15.63%) |
29.85 |
29.85 - 34.58 |
2.6233 times |
Tue 02 December 2025 |
29.75 (3.95%) |
29.12 |
28.69 - 30.00 |
0.5224 times |
Mon 01 December 2025 |
28.62 (-1.58%) |
28.62 |
28.36 - 29.34 |
0.4977 times |
Fri 28 November 2025 |
29.08 (1.47%) |
28.63 |
28.51 - 29.19 |
0.355 times |
Wed 26 November 2025 |
28.66 (-2.48%) |
29.44 |
28.44 - 29.50 |
0.5204 times |
Tue 25 November 2025 |
29.39 (3.56%) |
28.47 |
28.37 - 29.45 |
0.5582 times |
Mon 24 November 2025 |
28.38 (0.82%) |
28.35 |
27.58 - 28.66 |
0.5436 times |
Fri 21 November 2025 |
28.15 (6.27%) |
26.65 |
26.52 - 28.28 |
0.8724 times |
Thu 20 November 2025 |
26.49 (-3.04%) |
27.86 |
26.41 - 28.12 |
0.7811 times |
Wed 19 November 2025 |
27.32 (-0.94%) |
27.50 |
27.25 - 27.85 |
0.7166 times |
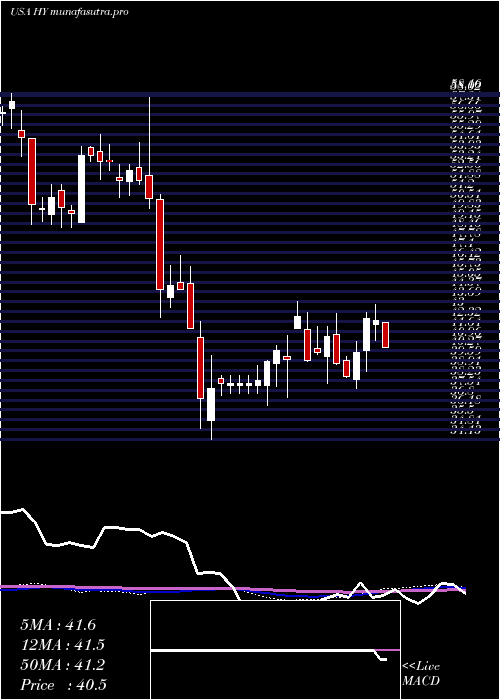
Weekly price and charts HysterYale Strong weekly Stock price targets for HysterYale HY are 31.7 and 42.12 | Weekly Target 1 | 23.64 | | Weekly Target 2 | 29.33 | | Weekly Target 3 | 34.056666666667 | | Weekly Target 4 | 39.75 | | Weekly Target 5 | 44.48 |
Weekly price and volumes for Hyster Yale
| Date |
Closing |
Open |
Range |
Volume |
Thu 04 December 2025 |
35.03 (20.46%) |
28.62 |
28.36 - 38.78 |
2.8289 times |
Fri 28 November 2025 |
29.08 (3.3%) |
28.35 |
27.58 - 29.50 |
0.8782 times |
Fri 21 November 2025 |
28.15 (-1.23%) |
28.65 |
26.41 - 28.87 |
1.6483 times |
Fri 14 November 2025 |
28.50 (-16.35%) |
34.35 |
28.45 - 34.35 |
1.6288 times |
Fri 07 November 2025 |
34.07 (-5.2%) |
35.31 |
31.06 - 36.06 |
1.0585 times |
Fri 31 October 2025 |
35.94 (0%) |
35.85 |
35.44 - 36.24 |
0.1176 times |
Fri 31 October 2025 |
35.94 (-4.72%) |
38.06 |
35.44 - 38.06 |
0.4769 times |
Fri 24 October 2025 |
37.72 (6.1%) |
36.01 |
35.94 - 37.94 |
0.4887 times |
Fri 17 October 2025 |
35.55 (1.48%) |
34.87 |
34.30 - 37.28 |
0.6359 times |
Tue 07 October 2025 |
35.03 (-4.6%) |
36.77 |
35.00 - 37.43 |
0.2383 times |
Fri 03 October 2025 |
36.72 (-1.13%) |
37.33 |
36.22 - 37.62 |
0.4721 times |
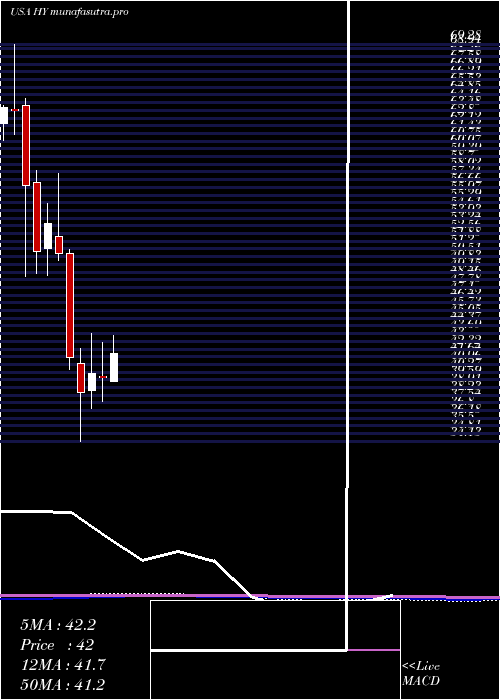
Monthly price and charts HysterYale Strong monthly Stock price targets for HysterYale HY are 31.7 and 42.12 | Monthly Target 1 | 23.64 | | Monthly Target 2 | 29.33 | | Monthly Target 3 | 34.056666666667 | | Monthly Target 4 | 39.75 | | Monthly Target 5 | 44.48 |
Monthly price and volumes Hyster Yale
| Date |
Closing |
Open |
Range |
Volume |
Thu 04 December 2025 |
35.03 (20.46%) |
28.62 |
28.36 - 38.78 |
0.8151 times |
Fri 28 November 2025 |
29.08 (-19.09%) |
35.31 |
26.41 - 36.06 |
1.5023 times |
Fri 31 October 2025 |
35.94 (-2.5%) |
36.45 |
34.30 - 38.06 |
0.6351 times |
Tue 30 September 2025 |
36.86 (-1.71%) |
36.99 |
35.44 - 38.15 |
1.2106 times |
Fri 29 August 2025 |
37.50 (-10.74%) |
41.33 |
35.33 - 42.33 |
1.1193 times |
Thu 31 July 2025 |
42.01 (5.61%) |
39.42 |
39.42 - 44.55 |
0.731 times |
Mon 30 June 2025 |
39.78 (-0.95%) |
39.91 |
37.67 - 42.89 |
0.7926 times |
Fri 30 May 2025 |
40.16 (4.5%) |
38.66 |
37.01 - 43.72 |
1.0226 times |
Wed 30 April 2025 |
38.43 (-7.49%) |
41.00 |
34.13 - 42.35 |
1.0712 times |
Mon 31 March 2025 |
41.54 (-18.26%) |
50.75 |
40.49 - 51.12 |
1.1003 times |
Fri 28 February 2025 |
50.82 (-4.87%) |
52.29 |
50.17 - 57.89 |
0.8578 times |
DMA SMA EMA moving averages of Hyster Yale HY
DMA (daily moving average) of Hyster Yale HY
| DMA period | DMA value | | 5 day DMA | 31.38 | | 12 day DMA | 29.4 | | 20 day DMA | 29.91 | | 35 day DMA | 32.6 | | 50 day DMA | 33.78 | | 100 day DMA | 36.28 | | 150 day DMA | 37.77 | | 200 day DMA | 39.21 | EMA (exponential moving average) of Hyster Yale HY
| EMA period | EMA current | EMA prev | EMA prev2 | | 5 day EMA | 32.23 | 30.83 | 29.04 | | 12 day EMA | 30.77 | 30 | 29.2 | | 20 day EMA | 30.98 | 30.55 | 30.15 | | 35 day EMA | 32.01 | 31.83 | 31.68 | | 50 day EMA | 33.81 | 33.76 | 33.73 |
SMA (simple moving average) of Hyster Yale HY
| SMA period | SMA current | SMA prev | SMA prev2 | | 5 day SMA | 31.38 | 30.1 | 29.1 | | 12 day SMA | 29.4 | 28.79 | 28.3 | | 20 day SMA | 29.91 | 29.86 | 29.87 | | 35 day SMA | 32.6 | 32.65 | 32.7 | | 50 day SMA | 33.78 | 33.81 | 33.89 | | 100 day SMA | 36.28 | 36.36 | 36.44 | | 150 day SMA | 37.77 | 37.8 | 37.83 | | 200 day SMA | 39.21 | 39.3 | 39.38 |
|
|
