HancockWhitney HWC full analysis,charts,indicators,moving averages,SMA,DMA,EMA,ADX,MACD,RSIHancock Whitney HWC WideScreen charts, DMA,SMA,EMA technical analysis, forecast prediction, by indicators ADX,MACD,RSI,CCI USA stock exchange
operates under Finance sector & deals in Major Banks
Daily price and charts and targets HancockWhitney Strong Daily Stock price targets for HancockWhitney HWC are 62.83 and 63.82 | Daily Target 1 | 62.02 | | Daily Target 2 | 62.65 | | Daily Target 3 | 63.01 | | Daily Target 4 | 63.64 | | Daily Target 5 | 64 |
Daily price and volume Hancock Whitney
| Date |
Closing |
Open |
Range |
Volume |
Fri 05 December 2025 |
63.28 (-0.42%) |
62.38 |
62.38 - 63.37 |
0.7393 times |
Thu 04 December 2025 |
63.55 (0.99%) |
62.64 |
62.24 - 63.66 |
0.7739 times |
Wed 03 December 2025 |
62.93 (2.14%) |
61.61 |
61.59 - 63.08 |
1.2677 times |
Tue 02 December 2025 |
61.61 (-0.58%) |
62.26 |
61.45 - 62.26 |
0.9086 times |
Mon 01 December 2025 |
61.97 (2.28%) |
60.10 |
59.74 - 62.20 |
1.3713 times |
Fri 28 November 2025 |
60.59 (-0.3%) |
60.85 |
60.53 - 61.02 |
0.6643 times |
Wed 26 November 2025 |
60.77 (0%) |
60.41 |
60.41 - 61.02 |
0.7636 times |
Tue 25 November 2025 |
60.77 (2.84%) |
59.44 |
59.23 - 61.34 |
0.8558 times |
Mon 24 November 2025 |
59.09 (-0.44%) |
59.29 |
58.67 - 59.45 |
0.8583 times |
Fri 21 November 2025 |
59.35 (4.38%) |
56.93 |
56.93 - 59.92 |
1.7973 times |
Thu 20 November 2025 |
56.86 (0%) |
57.40 |
56.51 - 58.48 |
1.0491 times |
Weekly price and charts HancockWhitney Strong weekly Stock price targets for HancockWhitney HWC are 61.51 and 65.43 | Weekly Target 1 | 58.31 | | Weekly Target 2 | 60.79 | | Weekly Target 3 | 62.226666666667 | | Weekly Target 4 | 64.71 | | Weekly Target 5 | 66.15 |
Weekly price and volumes for Hancock Whitney
| Date |
Closing |
Open |
Range |
Volume |
Fri 05 December 2025 |
63.28 (4.44%) |
60.10 |
59.74 - 63.66 |
0.8537 times |
Fri 28 November 2025 |
60.59 (2.09%) |
59.29 |
58.67 - 61.34 |
0.53 times |
Fri 21 November 2025 |
59.35 (1.16%) |
58.54 |
55.76 - 59.92 |
1.0465 times |
Fri 14 November 2025 |
58.67 (-0.17%) |
58.82 |
57.65 - 60.22 |
0.9836 times |
Fri 07 November 2025 |
58.77 (2.91%) |
57.58 |
57.05 - 59.13 |
1.0577 times |
Fri 31 October 2025 |
57.11 (0%) |
55.81 |
55.11 - 57.54 |
0.3494 times |
Fri 31 October 2025 |
57.11 (2.53%) |
56.10 |
55.11 - 57.82 |
1.3841 times |
Fri 24 October 2025 |
55.70 (0.78%) |
55.39 |
55.24 - 57.23 |
1.0913 times |
Fri 17 October 2025 |
55.27 (-6.34%) |
60.04 |
54.05 - 63.00 |
1.8031 times |
Fri 10 October 2025 |
59.01 (-5.58%) |
62.86 |
58.98 - 64.34 |
0.9006 times |
Fri 03 October 2025 |
62.50 (-1.2%) |
63.60 |
60.27 - 63.60 |
0.9157 times |

Monthly price and charts HancockWhitney Strong monthly Stock price targets for HancockWhitney HWC are 61.51 and 65.43 | Monthly Target 1 | 58.31 | | Monthly Target 2 | 60.79 | | Monthly Target 3 | 62.226666666667 | | Monthly Target 4 | 64.71 | | Monthly Target 5 | 66.15 |
Monthly price and volumes Hancock Whitney
| Date |
Closing |
Open |
Range |
Volume |
Fri 05 December 2025 |
63.28 (4.44%) |
60.10 |
59.74 - 63.66 |
0.2292 times |
Fri 28 November 2025 |
60.59 (6.09%) |
57.58 |
55.76 - 61.34 |
0.9711 times |
Fri 31 October 2025 |
57.11 (-8.78%) |
62.29 |
54.05 - 64.34 |
1.6312 times |
Tue 30 September 2025 |
62.61 (-0.49%) |
61.96 |
61.49 - 64.66 |
1.2333 times |
Fri 29 August 2025 |
62.92 (5.36%) |
58.80 |
56.87 - 64.25 |
0.8446 times |
Thu 31 July 2025 |
59.72 (4.04%) |
57.01 |
56.92 - 62.90 |
1.335 times |
Mon 30 June 2025 |
57.40 (4.99%) |
54.59 |
52.89 - 58.24 |
0.8606 times |
Fri 30 May 2025 |
54.67 (4.95%) |
52.46 |
51.60 - 58.22 |
0.7599 times |
Wed 30 April 2025 |
52.09 (-0.69%) |
51.98 |
43.90 - 53.10 |
1.1897 times |
Mon 31 March 2025 |
52.45 (-8.19%) |
57.16 |
49.46 - 57.84 |
0.9454 times |
Fri 28 February 2025 |
57.13 (-4.37%) |
58.05 |
55.54 - 61.36 |
0.74 times |

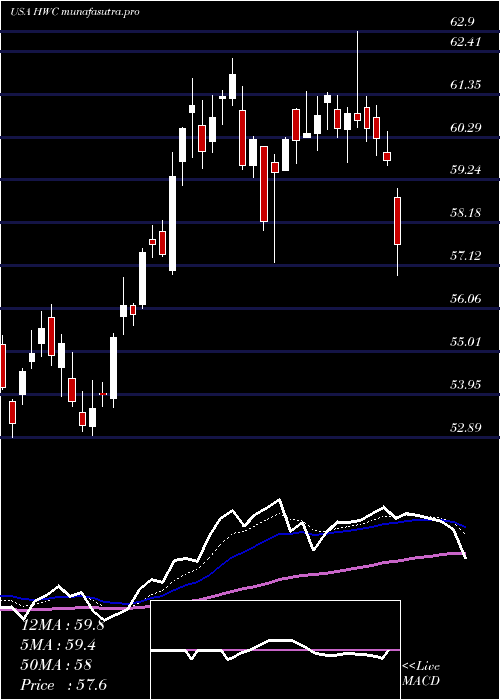
DMA SMA EMA moving averages of Hancock Whitney HWC
DMA (daily moving average) of Hancock Whitney HWC
| DMA period | DMA value | | 5 day DMA | 62.67 | | 12 day DMA | 60.64 | | 20 day DMA | 59.7 | | 35 day DMA | 58.42 | | 50 day DMA | 59.32 | | 100 day DMA | 60.42 | | 150 day DMA | 59.06 | | 200 day DMA | 57.26 | EMA (exponential moving average) of Hancock Whitney HWC
| EMA period | EMA current | EMA prev | EMA prev2 | | 5 day EMA | 62.6 | 62.26 | 61.62 | | 12 day EMA | 61.2 | 60.82 | 60.32 | | 20 day EMA | 60.34 | 60.03 | 59.66 | | 35 day EMA | 60.07 | 59.88 | 59.66 | | 50 day EMA | 59.95 | 59.81 | 59.66 |
SMA (simple moving average) of Hancock Whitney HWC
| SMA period | SMA current | SMA prev | SMA prev2 | | 5 day SMA | 62.67 | 62.13 | 61.57 | | 12 day SMA | 60.64 | 60.09 | 59.48 | | 20 day SMA | 59.7 | 59.44 | 59.19 | | 35 day SMA | 58.42 | 58.17 | 58.03 | | 50 day SMA | 59.32 | 59.31 | 59.3 | | 100 day SMA | 60.42 | 60.38 | 60.33 | | 150 day SMA | 59.06 | 58.99 | 58.92 | | 200 day SMA | 57.26 | 57.24 | 57.23 |
|
|
