HuronConsulting HURN full analysis,charts,indicators,moving averages,SMA,DMA,EMA,ADX,MACD,RSIHuron Consulting HURN WideScreen charts, DMA,SMA,EMA technical analysis, forecast prediction, by indicators ADX,MACD,RSI,CCI USA stock exchange
operates under Consumer Services sector & deals in Professional Services
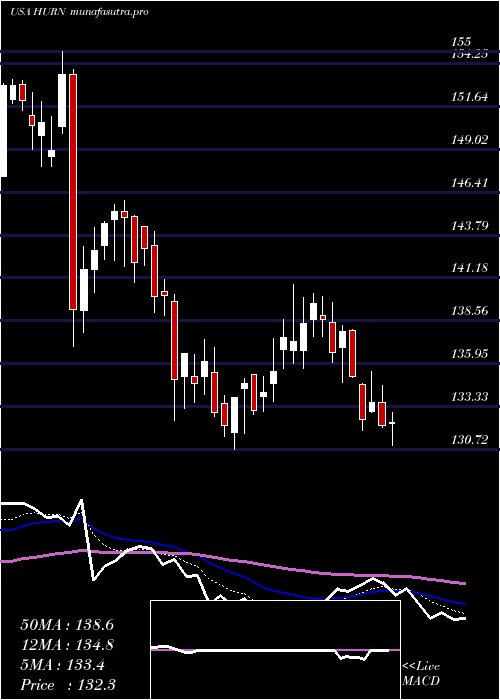
Daily price and charts and targets HuronConsulting Strong Daily Stock price targets for HuronConsulting HURN are 168.27 and 172.83 | Daily Target 1 | 164.48 | | Daily Target 2 | 167.5 | | Daily Target 3 | 169.04 | | Daily Target 4 | 172.06 | | Daily Target 5 | 173.6 |
Daily price and volume Huron Consulting
| Date |
Closing |
Open |
Range |
Volume |
Thu 04 December 2025 |
170.52 (2.58%) |
166.23 |
166.02 - 170.58 |
1.0014 times |
Wed 03 December 2025 |
166.23 (0.86%) |
165.44 |
164.88 - 168.19 |
1.1681 times |
Tue 02 December 2025 |
164.81 (0.64%) |
164.78 |
163.94 - 165.90 |
0.8918 times |
Mon 01 December 2025 |
163.77 (-0.51%) |
164.20 |
163.31 - 166.87 |
0.6605 times |
Fri 28 November 2025 |
164.61 (-0.24%) |
165.69 |
163.38 - 165.96 |
0.3962 times |
Wed 26 November 2025 |
165.01 (0.02%) |
164.16 |
163.63 - 165.79 |
0.6027 times |
Tue 25 November 2025 |
164.98 (2.39%) |
162.59 |
162.13 - 168.07 |
0.8535 times |
Mon 24 November 2025 |
161.13 (-1.36%) |
163.35 |
160.25 - 165.00 |
1.3866 times |
Fri 21 November 2025 |
163.35 (0.24%) |
162.93 |
162.00 - 166.74 |
1.475 times |
Thu 20 November 2025 |
162.96 (0.36%) |
164.50 |
161.37 - 165.70 |
1.5642 times |
Wed 19 November 2025 |
162.38 (0.86%) |
161.92 |
159.68 - 164.50 |
1.2199 times |
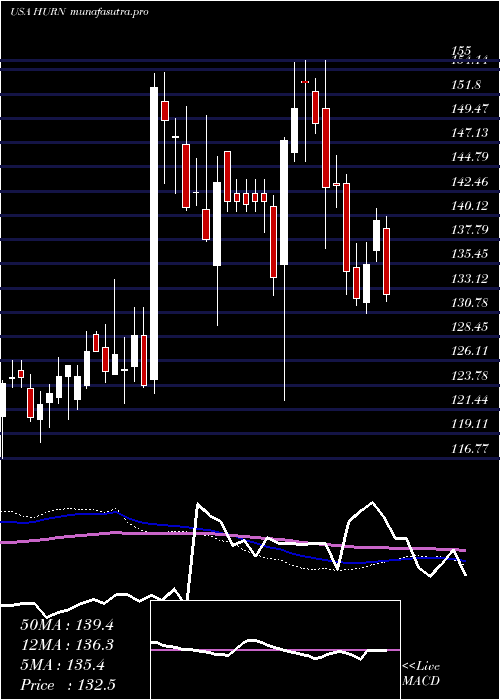
Weekly price and charts HuronConsulting Strong weekly Stock price targets for HuronConsulting HURN are 166.92 and 174.19 | Weekly Target 1 | 160.87 | | Weekly Target 2 | 165.69 | | Weekly Target 3 | 168.13666666667 | | Weekly Target 4 | 172.96 | | Weekly Target 5 | 175.41 |
Weekly price and volumes for Huron Consulting
| Date |
Closing |
Open |
Range |
Volume |
Thu 04 December 2025 |
170.52 (3.59%) |
164.20 |
163.31 - 170.58 |
0.5926 times |
Fri 28 November 2025 |
164.61 (0.77%) |
163.35 |
160.25 - 168.07 |
0.5157 times |
Fri 21 November 2025 |
163.35 (-1.3%) |
165.09 |
158.72 - 166.74 |
1.009 times |
Fri 14 November 2025 |
165.50 (-0.11%) |
166.86 |
160.52 - 169.00 |
1.0319 times |
Fri 07 November 2025 |
165.69 (0.76%) |
165.00 |
162.33 - 169.00 |
1.2799 times |
Fri 31 October 2025 |
164.44 (0%) |
165.40 |
160.88 - 166.19 |
0.3503 times |
Fri 31 October 2025 |
164.44 (7.43%) |
153.22 |
150.49 - 174.26 |
2.152 times |
Fri 24 October 2025 |
153.07 (3.39%) |
149.54 |
149.32 - 154.40 |
0.6392 times |
Fri 17 October 2025 |
148.05 (2.1%) |
145.28 |
144.77 - 152.56 |
1.1329 times |
Fri 10 October 2025 |
145.01 (-3.53%) |
150.18 |
144.66 - 153.66 |
1.2964 times |
Fri 03 October 2025 |
150.32 (2.97%) |
145.61 |
143.99 - 150.64 |
0.9135 times |
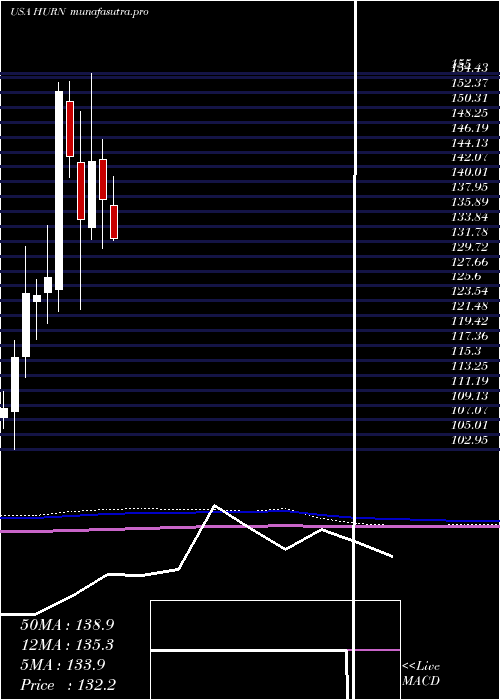
Monthly price and charts HuronConsulting Strong monthly Stock price targets for HuronConsulting HURN are 166.92 and 174.19 | Monthly Target 1 | 160.87 | | Monthly Target 2 | 165.69 | | Monthly Target 3 | 168.13666666667 | | Monthly Target 4 | 172.96 | | Monthly Target 5 | 175.41 |
Monthly price and volumes Huron Consulting
| Date |
Closing |
Open |
Range |
Volume |
Thu 04 December 2025 |
170.52 (3.59%) |
164.20 |
163.31 - 170.58 |
0.1161 times |
Fri 28 November 2025 |
164.61 (0.1%) |
165.00 |
158.72 - 169.00 |
0.7518 times |
Fri 31 October 2025 |
164.44 (12.04%) |
145.68 |
144.66 - 174.26 |
1.2092 times |
Tue 30 September 2025 |
146.77 (7.16%) |
136.21 |
135.79 - 147.19 |
0.8421 times |
Fri 29 August 2025 |
136.96 (3.69%) |
129.11 |
120.25 - 139.42 |
1.1956 times |
Thu 31 July 2025 |
132.08 (-3.97%) |
136.74 |
129.50 - 140.77 |
0.9365 times |
Mon 30 June 2025 |
137.54 (-3.7%) |
143.17 |
130.72 - 145.92 |
0.9863 times |
Fri 30 May 2025 |
142.83 (5.96%) |
133.63 |
131.99 - 155.00 |
1.3596 times |
Wed 30 April 2025 |
134.79 (-6.04%) |
142.67 |
122.32 - 149.71 |
1.3987 times |
Mon 31 March 2025 |
143.45 (-5.91%) |
151.13 |
140.62 - 153.85 |
1.2042 times |
Fri 28 February 2025 |
152.46 (20.26%) |
125.15 |
122.01 - 153.77 |
0.8854 times |
DMA SMA EMA moving averages of Huron Consulting HURN
DMA (daily moving average) of Huron Consulting HURN
| DMA period | DMA value | | 5 day DMA | 165.99 | | 12 day DMA | 164.23 | | 20 day DMA | 164.48 | | 35 day DMA | 161.47 | | 50 day DMA | 157.39 | | 100 day DMA | 146.66 | | 150 day DMA | 145.11 | | 200 day DMA | 144.22 | EMA (exponential moving average) of Huron Consulting HURN
| EMA period | EMA current | EMA prev | EMA prev2 | | 5 day EMA | 166.78 | 164.91 | 164.25 | | 12 day EMA | 165.12 | 164.14 | 163.76 | | 20 day EMA | 163.81 | 163.1 | 162.77 | | 35 day EMA | 160.39 | 159.79 | 159.41 | | 50 day EMA | 157.09 | 156.54 | 156.14 |
SMA (simple moving average) of Huron Consulting HURN
| SMA period | SMA current | SMA prev | SMA prev2 | | 5 day SMA | 165.99 | 164.89 | 164.64 | | 12 day SMA | 164.23 | 163.4 | 163.34 | | 20 day SMA | 164.48 | 164.33 | 164.27 | | 35 day SMA | 161.47 | 160.91 | 160.41 | | 50 day SMA | 157.39 | 156.85 | 156.38 | | 100 day SMA | 146.66 | 146.27 | 145.95 | | 150 day SMA | 145.11 | 144.87 | 144.67 | | 200 day SMA | 144.22 | 144.02 | 143.83 |
|
|
