HubspotInc HUBS full analysis,charts,indicators,moving averages,SMA,DMA,EMA,ADX,MACD,RSIHubspot Inc HUBS WideScreen charts, DMA,SMA,EMA technical analysis, forecast prediction, by indicators ADX,MACD,RSI,CCI USA stock exchange
operates under Technology sector & deals in Computer Software Prepackaged Software
Daily price and charts and targets HubspotInc Strong Daily Stock price targets for HubspotInc HUBS are 433.41 and 445.76 | Daily Target 1 | 424.04 | | Daily Target 2 | 430.43 | | Daily Target 3 | 436.39 | | Daily Target 4 | 442.78 | | Daily Target 5 | 448.74 |
Daily price and volume Hubspot Inc
| Date |
Closing |
Open |
Range |
Volume |
Fri 17 October 2025 |
436.82 (0.95%) |
431.49 |
430.00 - 442.35 |
0.6824 times |
Thu 16 October 2025 |
432.70 (-2.86%) |
448.55 |
432.38 - 463.00 |
0.8564 times |
Wed 15 October 2025 |
445.44 (-2.44%) |
467.27 |
444.16 - 468.81 |
0.7902 times |
Tue 14 October 2025 |
456.58 (1.49%) |
444.30 |
442.34 - 461.98 |
0.7147 times |
Mon 13 October 2025 |
449.88 (2.32%) |
442.57 |
440.15 - 453.51 |
0.7603 times |
Fri 10 October 2025 |
439.66 (-2.94%) |
456.45 |
436.86 - 457.35 |
1.1776 times |
Thu 09 October 2025 |
452.99 (-1.43%) |
456.65 |
450.00 - 460.00 |
0.9773 times |
Wed 08 October 2025 |
459.56 (2.04%) |
452.10 |
446.26 - 459.77 |
0.9068 times |
Tue 07 October 2025 |
450.37 (-3.21%) |
460.05 |
432.78 - 468.40 |
1.4006 times |
Mon 06 October 2025 |
465.30 (2.81%) |
453.36 |
443.24 - 503.00 |
1.7337 times |
Fri 03 October 2025 |
452.60 (1.67%) |
448.19 |
447.11 - 458.90 |
0.5885 times |
Weekly price and charts HubspotInc Strong weekly Stock price targets for HubspotInc HUBS are 414.01 and 452.82 | Weekly Target 1 | 406.4 | | Weekly Target 2 | 421.61 | | Weekly Target 3 | 445.21 | | Weekly Target 4 | 460.42 | | Weekly Target 5 | 484.02 |
Weekly price and volumes for Hubspot Inc
| Date |
Closing |
Open |
Range |
Volume |
Fri 17 October 2025 |
436.82 (-0.65%) |
442.57 |
430.00 - 468.81 |
0.8317 times |
Fri 10 October 2025 |
439.66 (-2.86%) |
453.36 |
432.78 - 503.00 |
1.3546 times |
Fri 03 October 2025 |
452.60 (-12.58%) |
517.91 |
423.11 - 524.63 |
1.8911 times |
Fri 26 September 2025 |
517.76 (-0.21%) |
512.15 |
503.25 - 525.51 |
0.7174 times |
Fri 19 September 2025 |
518.84 (5.57%) |
495.00 |
492.25 - 521.54 |
0.9224 times |
Fri 12 September 2025 |
491.48 (0.81%) |
490.00 |
486.60 - 508.63 |
0.959 times |
Fri 05 September 2025 |
487.53 (0.9%) |
470.52 |
453.03 - 492.15 |
0.9539 times |
Fri 29 August 2025 |
483.17 (0%) |
477.44 |
476.77 - 485.52 |
0.2142 times |
Fri 29 August 2025 |
483.17 (1.87%) |
475.04 |
456.51 - 485.52 |
0.994 times |
Fri 22 August 2025 |
474.30 (7.95%) |
437.62 |
437.00 - 476.38 |
1.1617 times |
Fri 15 August 2025 |
439.37 (-2.3%) |
444.28 |
418.34 - 447.85 |
1.6804 times |

Monthly price and charts HubspotInc Strong monthly Stock price targets for HubspotInc HUBS are 390.02 and 469.91 | Monthly Target 1 | 374.42 | | Monthly Target 2 | 405.62 | | Monthly Target 3 | 454.31 | | Monthly Target 4 | 485.51 | | Monthly Target 5 | 534.2 |
Monthly price and volumes Hubspot Inc
| Date |
Closing |
Open |
Range |
Volume |
Fri 17 October 2025 |
436.82 (-6.62%) |
472.55 |
423.11 - 503.00 |
0.8684 times |
Tue 30 September 2025 |
467.80 (-3.18%) |
470.52 |
453.03 - 525.51 |
1.0924 times |
Fri 29 August 2025 |
483.17 (-7.02%) |
510.00 |
418.34 - 522.80 |
1.5153 times |
Thu 31 July 2025 |
519.65 (-6.64%) |
555.02 |
516.63 - 568.16 |
1.1075 times |
Mon 30 June 2025 |
556.63 (-5.64%) |
587.62 |
527.74 - 611.00 |
1.0139 times |
Fri 30 May 2025 |
589.90 (-3.53%) |
617.23 |
567.28 - 682.57 |
1.0937 times |
Wed 30 April 2025 |
611.50 (7.04%) |
573.72 |
472.28 - 622.38 |
1.0198 times |
Mon 31 March 2025 |
571.29 (-21.09%) |
730.05 |
550.76 - 732.00 |
0.9036 times |
Fri 28 February 2025 |
723.99 (-7.12%) |
766.40 |
701.49 - 881.13 |
0.7293 times |
Fri 31 January 2025 |
779.53 (11.88%) |
704.98 |
685.67 - 811.79 |
0.6562 times |
Tue 31 December 2024 |
696.77 (-4.53%) |
715.28 |
685.01 - 755.07 |
0.4516 times |

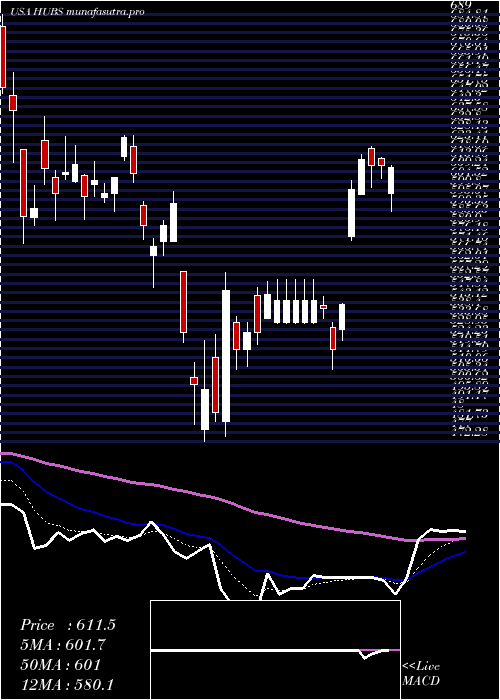
DMA SMA EMA moving averages of Hubspot Inc HUBS
DMA (daily moving average) of Hubspot Inc HUBS
| DMA period | DMA value | | 5 day DMA | 444.28 | | 12 day DMA | 448.92 | | 20 day DMA | 469.54 | | 35 day DMA | 479.95 | | 50 day DMA | 471.59 | | 100 day DMA | 512.22 | | 150 day DMA | 538.58 | | 200 day DMA | 584.81 | EMA (exponential moving average) of Hubspot Inc HUBS
| EMA period | EMA current | EMA prev | EMA prev2 | | 5 day EMA | 441.91 | 444.46 | 450.34 | | 12 day EMA | 452.16 | 454.95 | 458.99 | | 20 day EMA | 460.89 | 463.42 | 466.65 | | 35 day EMA | 465.3 | 466.98 | 469 | | 50 day EMA | 469.4 | 470.73 | 472.28 |
SMA (simple moving average) of Hubspot Inc HUBS
| SMA period | SMA current | SMA prev | SMA prev2 | | 5 day SMA | 444.28 | 444.85 | 448.91 | | 12 day SMA | 448.92 | 449.21 | 452.13 | | 20 day SMA | 469.54 | 473.65 | 477.67 | | 35 day SMA | 479.95 | 481.28 | 482.52 | | 50 day SMA | 471.59 | 471.85 | 472.43 | | 100 day SMA | 512.22 | 514 | 515.96 | | 150 day SMA | 538.58 | 539.72 | 540.83 | | 200 day SMA | 584.81 | 586.11 | 587.43 |
|
|
