HubbellInc HUBB full analysis,charts,indicators,moving averages,SMA,DMA,EMA,ADX,MACD,RSIHubbell Inc HUBB WideScreen charts, DMA,SMA,EMA technical analysis, forecast prediction, by indicators ADX,MACD,RSI,CCI USA stock exchange
operates under Capital Goods sector & deals in Electrical Products
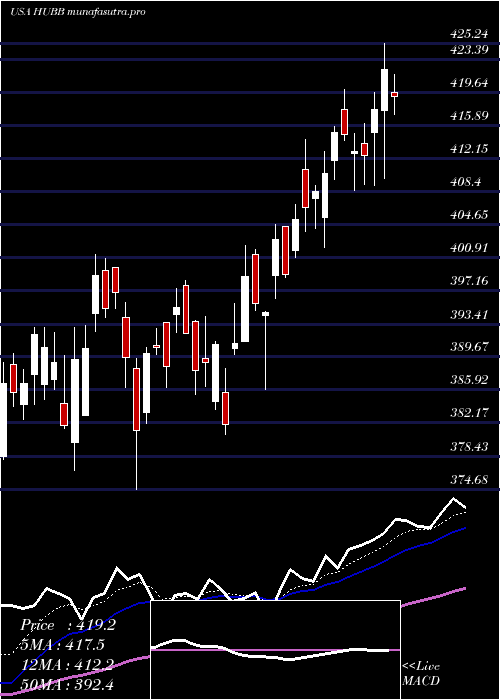
Daily price and charts and targets HubbellInc Strong Daily Stock price targets for HubbellInc HUBB are 431.77 and 445.38 | Daily Target 1 | 420.72 | | Daily Target 2 | 429.21 | | Daily Target 3 | 434.32666666667 | | Daily Target 4 | 442.82 | | Daily Target 5 | 447.94 |
Daily price and volume Hubbell Inc
| Date |
Closing |
Open |
Range |
Volume |
Thu 04 December 2025 |
437.71 (1.95%) |
428.03 |
425.83 - 439.44 |
0.8589 times |
Wed 03 December 2025 |
429.34 (0.44%) |
426.40 |
422.10 - 431.26 |
0.7806 times |
Tue 02 December 2025 |
427.48 (-0.09%) |
428.40 |
422.39 - 430.70 |
1.0271 times |
Mon 01 December 2025 |
427.85 (-0.83%) |
426.61 |
425.82 - 432.90 |
0.8852 times |
Fri 28 November 2025 |
431.43 (0.69%) |
428.01 |
427.10 - 432.44 |
0.4091 times |
Wed 26 November 2025 |
428.47 (-0.31%) |
429.91 |
428.32 - 433.46 |
0.7511 times |
Tue 25 November 2025 |
429.82 (1.35%) |
424.69 |
420.29 - 431.08 |
0.6343 times |
Mon 24 November 2025 |
424.08 (0.53%) |
421.94 |
417.80 - 430.80 |
1.1916 times |
Fri 21 November 2025 |
421.84 (3.55%) |
407.59 |
403.82 - 423.49 |
1.7537 times |
Thu 20 November 2025 |
407.36 (-2.8%) |
430.16 |
405.16 - 432.48 |
1.7083 times |
Wed 19 November 2025 |
419.09 (0.43%) |
420.09 |
415.96 - 422.89 |
0.9117 times |
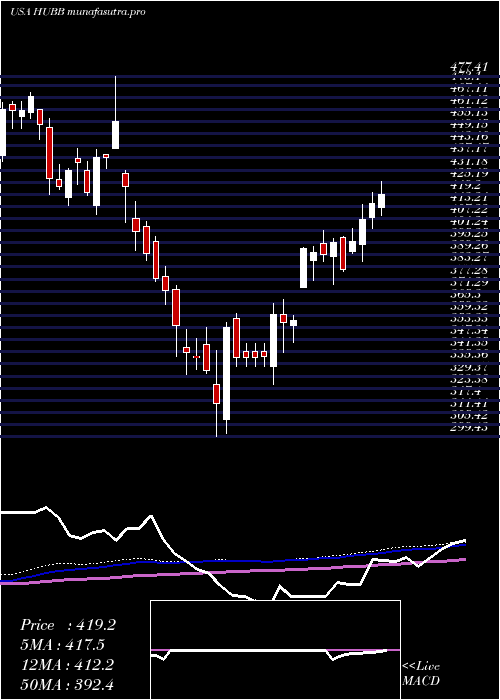
Weekly price and charts HubbellInc Strong weekly Stock price targets for HubbellInc HUBB are 429.91 and 447.25 | Weekly Target 1 | 415.74 | | Weekly Target 2 | 426.73 | | Weekly Target 3 | 433.08333333333 | | Weekly Target 4 | 444.07 | | Weekly Target 5 | 450.42 |
Weekly price and volumes for Hubbell Inc
| Date |
Closing |
Open |
Range |
Volume |
Thu 04 December 2025 |
437.71 (1.46%) |
426.61 |
422.10 - 439.44 |
0.7201 times |
Fri 28 November 2025 |
431.43 (2.27%) |
421.94 |
417.80 - 433.46 |
0.6054 times |
Fri 21 November 2025 |
421.84 (-2.54%) |
429.81 |
403.82 - 434.13 |
1.4133 times |
Fri 14 November 2025 |
432.82 (-6.4%) |
465.23 |
428.11 - 468.52 |
1.0725 times |
Fri 07 November 2025 |
462.43 (-1.61%) |
462.14 |
453.08 - 474.25 |
1.073 times |
Fri 31 October 2025 |
470.00 (0%) |
472.70 |
467.53 - 477.29 |
0.3395 times |
Fri 31 October 2025 |
470.00 (8.2%) |
438.53 |
415.95 - 484.26 |
2.3779 times |
Fri 24 October 2025 |
434.39 (2.04%) |
431.17 |
420.80 - 440.08 |
0.835 times |
Fri 17 October 2025 |
425.71 (3.09%) |
412.15 |
410.98 - 438.08 |
1.1838 times |
Tue 07 October 2025 |
412.93 (-0.02%) |
420.34 |
410.53 - 420.91 |
0.3795 times |
Fri 03 October 2025 |
413.00 (-2.87%) |
428.52 |
411.75 - 436.78 |
1.0676 times |
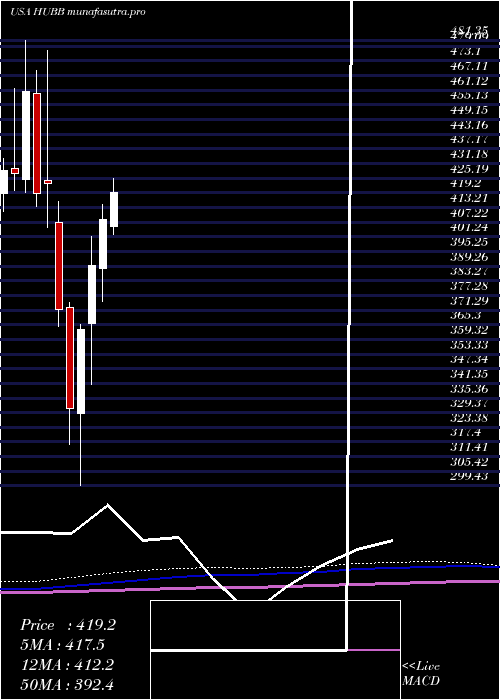
Monthly price and charts HubbellInc Strong monthly Stock price targets for HubbellInc HUBB are 429.91 and 447.25 | Monthly Target 1 | 415.74 | | Monthly Target 2 | 426.73 | | Monthly Target 3 | 433.08333333333 | | Monthly Target 4 | 444.07 | | Monthly Target 5 | 450.42 |
Monthly price and volumes Hubbell Inc
| Date |
Closing |
Open |
Range |
Volume |
Thu 04 December 2025 |
437.71 (1.46%) |
426.61 |
422.10 - 439.44 |
0.1412 times |
Fri 28 November 2025 |
431.43 (-8.21%) |
462.14 |
403.82 - 474.25 |
0.8167 times |
Fri 31 October 2025 |
470.00 (9.22%) |
426.79 |
410.53 - 484.26 |
1.1288 times |
Tue 30 September 2025 |
430.31 (-0.16%) |
430.61 |
416.22 - 453.20 |
0.9601 times |
Fri 29 August 2025 |
430.99 (-1.48%) |
428.90 |
415.57 - 450.39 |
0.8797 times |
Thu 31 July 2025 |
437.48 (7.12%) |
405.46 |
402.04 - 447.79 |
1.2016 times |
Mon 30 June 2025 |
408.41 (4.83%) |
388.34 |
374.68 - 414.31 |
0.8959 times |
Fri 30 May 2025 |
389.58 (7.27%) |
365.93 |
341.03 - 401.27 |
1.4033 times |
Wed 30 April 2025 |
363.18 (9.75%) |
329.10 |
299.43 - 365.42 |
1.2843 times |
Mon 31 March 2025 |
330.91 (-10.95%) |
372.21 |
316.34 - 374.19 |
1.2883 times |
Fri 28 February 2025 |
371.59 (-12.16%) |
407.06 |
364.63 - 415.64 |
1.2476 times |
DMA SMA EMA moving averages of Hubbell Inc HUBB
DMA (daily moving average) of Hubbell Inc HUBB
| DMA period | DMA value | | 5 day DMA | 430.76 | | 12 day DMA | 425.15 | | 20 day DMA | 434.1 | | 35 day DMA | 439.8 | | 50 day DMA | 435.48 | | 100 day DMA | 434.11 | | 150 day DMA | 418.7 | | 200 day DMA | 401.42 | EMA (exponential moving average) of Hubbell Inc HUBB
| EMA period | EMA current | EMA prev | EMA prev2 | | 5 day EMA | 431.38 | 428.21 | 427.65 | | 12 day EMA | 430.7 | 429.42 | 429.44 | | 20 day EMA | 432.9 | 432.39 | 432.71 | | 35 day EMA | 433.18 | 432.91 | 433.12 | | 50 day EMA | 435.2 | 435.1 | 435.34 |
SMA (simple moving average) of Hubbell Inc HUBB
| SMA period | SMA current | SMA prev | SMA prev2 | | 5 day SMA | 430.76 | 428.91 | 429.01 | | 12 day SMA | 425.15 | 423.72 | 424.01 | | 20 day SMA | 434.1 | 435.62 | 437.12 | | 35 day SMA | 439.8 | 439.7 | 439.64 | | 50 day SMA | 435.48 | 435.55 | 435.77 | | 100 day SMA | 434.11 | 433.96 | 433.84 | | 150 day SMA | 418.7 | 418.18 | 417.72 | | 200 day SMA | 401.42 | 401.19 | 401.02 |
|
|
