HerculesCapital HTGC full analysis,charts,indicators,moving averages,SMA,DMA,EMA,ADX,MACD,RSIHercules Capital HTGC WideScreen charts, DMA,SMA,EMA technical analysis, forecast prediction, by indicators ADX,MACD,RSI,CCI USA stock exchange
operates under N A sector & deals in N A
Daily price and charts and targets HerculesCapital Strong Daily Stock price targets for HerculesCapital HTGC are 17.61 and 17.92 | Daily Target 1 | 17.36 | | Daily Target 2 | 17.55 | | Daily Target 3 | 17.673333333333 | | Daily Target 4 | 17.86 | | Daily Target 5 | 17.98 |
Daily price and volume Hercules Capital
| Date |
Closing |
Open |
Range |
Volume |
Tue 21 October 2025 |
17.73 (1.37%) |
17.49 |
17.49 - 17.80 |
0.7537 times |
Mon 20 October 2025 |
17.49 (1.27%) |
17.40 |
17.31 - 17.50 |
0.5564 times |
Fri 17 October 2025 |
17.27 (0.64%) |
17.16 |
17.13 - 17.33 |
0.7429 times |
Thu 16 October 2025 |
17.16 (-1.32%) |
17.45 |
17.11 - 17.47 |
0.6187 times |
Wed 15 October 2025 |
17.39 (-0.17%) |
17.57 |
17.31 - 17.60 |
0.7161 times |
Tue 14 October 2025 |
17.42 (1.69%) |
16.95 |
16.95 - 17.45 |
0.8556 times |
Mon 13 October 2025 |
17.13 (2.57%) |
16.83 |
16.75 - 17.14 |
0.9859 times |
Fri 10 October 2025 |
16.70 (-2.11%) |
17.11 |
16.63 - 17.19 |
1.9751 times |
Thu 09 October 2025 |
17.06 (-3.67%) |
17.60 |
17.04 - 17.63 |
1.7022 times |
Wed 08 October 2025 |
17.71 (-1.17%) |
17.97 |
17.66 - 18.06 |
1.0935 times |
Tue 07 October 2025 |
17.92 (-2.08%) |
18.30 |
17.80 - 18.32 |
1.1508 times |
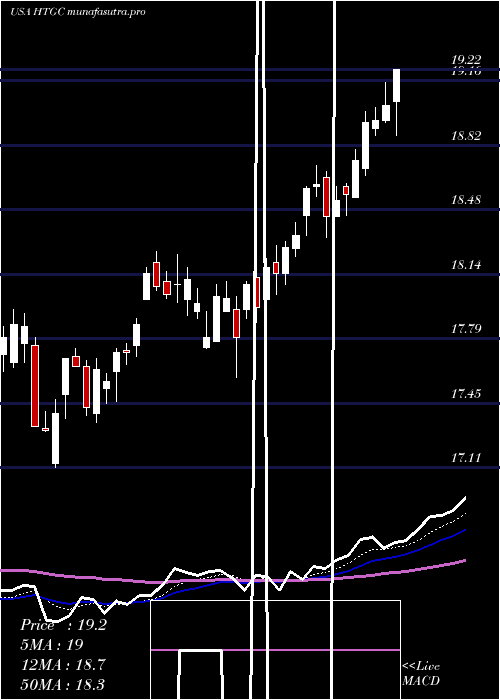
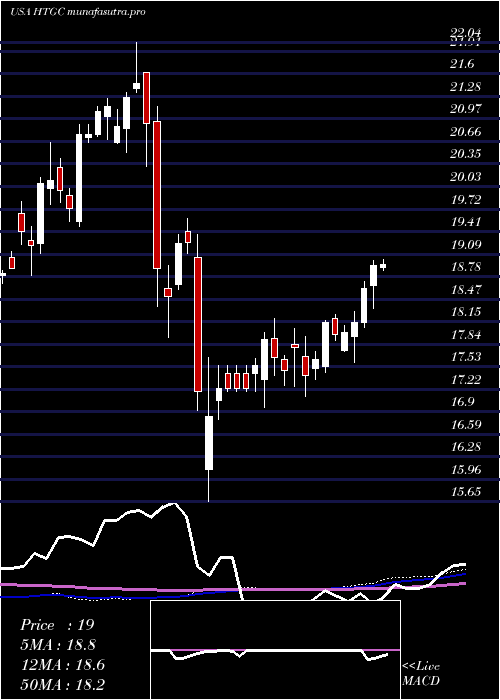
Weekly price and charts HerculesCapital Strong weekly Stock price targets for HerculesCapital HTGC are 17.52 and 18.01 | Weekly Target 1 | 17.12 | | Weekly Target 2 | 17.43 | | Weekly Target 3 | 17.613333333333 | | Weekly Target 4 | 17.92 | | Weekly Target 5 | 18.1 |
Weekly price and volumes for Hercules Capital
| Date |
Closing |
Open |
Range |
Volume |
Tue 21 October 2025 |
17.73 (2.66%) |
17.40 |
17.31 - 17.80 |
0.4763 times |
Fri 17 October 2025 |
17.27 (3.41%) |
16.83 |
16.75 - 17.60 |
1.4248 times |
Fri 10 October 2025 |
16.70 (-9.24%) |
18.46 |
16.63 - 18.56 |
2.3696 times |
Fri 03 October 2025 |
18.40 (-3.72%) |
19.17 |
18.40 - 19.17 |
1.0029 times |
Fri 26 September 2025 |
19.11 (-2.1%) |
19.46 |
18.80 - 19.46 |
1.0427 times |
Fri 19 September 2025 |
19.52 (0.41%) |
19.45 |
19.07 - 19.55 |
1.1962 times |
Fri 12 September 2025 |
19.44 (1.09%) |
19.22 |
19.16 - 19.62 |
0.887 times |
Fri 05 September 2025 |
19.23 (-1.49%) |
19.40 |
19.13 - 19.49 |
0.7057 times |
Fri 29 August 2025 |
19.52 (0%) |
19.45 |
19.45 - 19.57 |
0.1497 times |
Fri 29 August 2025 |
19.52 (1.51%) |
19.28 |
19.03 - 19.57 |
0.745 times |
Fri 22 August 2025 |
19.23 (0.89%) |
19.05 |
18.98 - 19.38 |
1.1597 times |
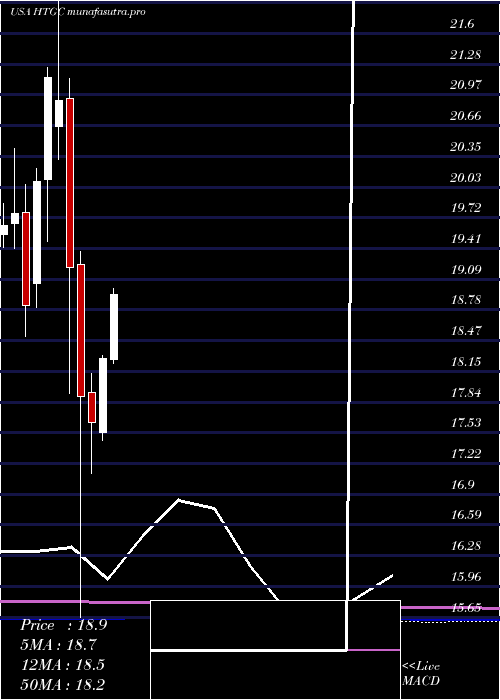
Monthly price and charts HerculesCapital Strong monthly Stock price targets for HerculesCapital HTGC are 16.04 and 18.32 | Monthly Target 1 | 15.48 | | Monthly Target 2 | 16.6 | | Monthly Target 3 | 17.756666666667 | | Monthly Target 4 | 18.88 | | Monthly Target 5 | 20.04 |
Monthly price and volumes Hercules Capital
| Date |
Closing |
Open |
Range |
Volume |
Tue 21 October 2025 |
17.73 (-6.24%) |
18.91 |
16.63 - 18.91 |
0.9256 times |
Tue 30 September 2025 |
18.91 (-3.13%) |
19.40 |
18.77 - 19.62 |
0.8006 times |
Fri 29 August 2025 |
19.52 (4.05%) |
19.00 |
18.75 - 19.67 |
0.9292 times |
Thu 31 July 2025 |
18.76 (2.63%) |
18.27 |
18.23 - 19.65 |
0.9532 times |
Mon 30 June 2025 |
18.28 (3.69%) |
17.53 |
17.45 - 18.31 |
0.7463 times |
Fri 30 May 2025 |
17.63 (-1.51%) |
17.94 |
17.11 - 18.13 |
1.3858 times |
Wed 30 April 2025 |
17.90 (-6.82%) |
19.24 |
15.65 - 19.37 |
1.1758 times |
Mon 31 March 2025 |
19.21 (-8.13%) |
20.93 |
17.93 - 21.14 |
1.3844 times |
Fri 28 February 2025 |
20.91 (-1.13%) |
20.65 |
20.31 - 22.04 |
0.8265 times |
Fri 31 January 2025 |
21.15 (5.28%) |
20.11 |
19.48 - 21.25 |
0.8727 times |
Tue 31 December 2024 |
20.09 (6.75%) |
19.05 |
18.80 - 20.22 |
0.6585 times |
DMA SMA EMA moving averages of Hercules Capital HTGC
DMA (daily moving average) of Hercules Capital HTGC
| DMA period | DMA value | | 5 day DMA | 17.41 | | 12 day DMA | 17.44 | | 20 day DMA | 18 | | 35 day DMA | 18.56 | | 50 day DMA | 18.78 | | 100 day DMA | 18.69 | | 150 day DMA | 18.39 | | 200 day DMA | 18.88 | EMA (exponential moving average) of Hercules Capital HTGC
| EMA period | EMA current | EMA prev | EMA prev2 | | 5 day EMA | 17.48 | 17.35 | 17.28 | | 12 day EMA | 17.61 | 17.59 | 17.61 | | 20 day EMA | 17.9 | 17.92 | 17.96 | | 35 day EMA | 18.28 | 18.31 | 18.36 | | 50 day EMA | 18.7 | 18.74 | 18.79 |
SMA (simple moving average) of Hercules Capital HTGC
| SMA period | SMA current | SMA prev | SMA prev2 | | 5 day SMA | 17.41 | 17.35 | 17.27 | | 12 day SMA | 17.44 | 17.5 | 17.61 | | 20 day SMA | 18 | 18.07 | 18.15 | | 35 day SMA | 18.56 | 18.61 | 18.66 | | 50 day SMA | 18.78 | 18.81 | 18.85 | | 100 day SMA | 18.69 | 18.68 | 18.69 | | 150 day SMA | 18.39 | 18.4 | 18.4 | | 200 day SMA | 18.88 | 18.89 | 18.9 |
|
|
