HarrowHealth HROW full analysis,charts,indicators,moving averages,SMA,DMA,EMA,ADX,MACD,RSIHarrow Health HROW WideScreen charts, DMA,SMA,EMA technical analysis, forecast prediction, by indicators ADX,MACD,RSI,CCI USA stock exchange
operates under Health Care sector & deals in Major Pharmaceuticals
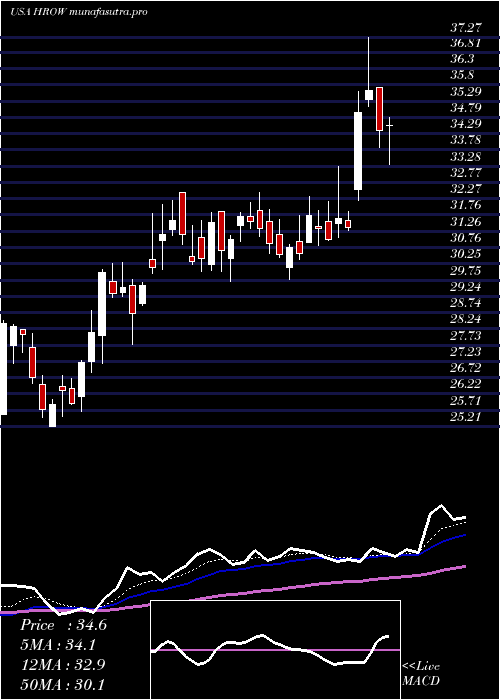
Daily price and charts and targets HarrowHealth Strong Daily Stock price targets for HarrowHealth HROW are 38.54 and 42.44 | Daily Target 1 | 35.29 | | Daily Target 2 | 37.89 | | Daily Target 3 | 39.193333333333 | | Daily Target 4 | 41.79 | | Daily Target 5 | 43.09 |
Daily price and volume Harrow Health
| Date |
Closing |
Open |
Range |
Volume |
Fri 17 October 2025 |
40.48 (8.55%) |
36.80 |
36.60 - 40.50 |
0.6037 times |
Thu 16 October 2025 |
37.29 (-5.45%) |
38.98 |
37.22 - 40.50 |
0.4575 times |
Wed 15 October 2025 |
39.44 (0.2%) |
39.63 |
39.07 - 40.72 |
0.6128 times |
Tue 14 October 2025 |
39.36 (1.52%) |
37.70 |
37.50 - 40.16 |
0.6019 times |
Mon 13 October 2025 |
38.77 (3.44%) |
38.00 |
36.83 - 38.84 |
0.7369 times |
Fri 10 October 2025 |
37.48 (-7.62%) |
40.75 |
37.39 - 41.08 |
1.1811 times |
Thu 09 October 2025 |
40.57 (2.09%) |
39.83 |
37.90 - 41.63 |
1.9846 times |
Wed 08 October 2025 |
39.74 (-5.16%) |
41.94 |
38.81 - 42.35 |
1.5403 times |
Tue 07 October 2025 |
41.90 (-1.53%) |
42.22 |
40.79 - 42.90 |
0.8888 times |
Mon 06 October 2025 |
42.55 (-6.34%) |
45.70 |
41.03 - 46.03 |
1.3924 times |
Fri 03 October 2025 |
45.43 (-5.35%) |
47.23 |
44.94 - 47.51 |
1.2882 times |
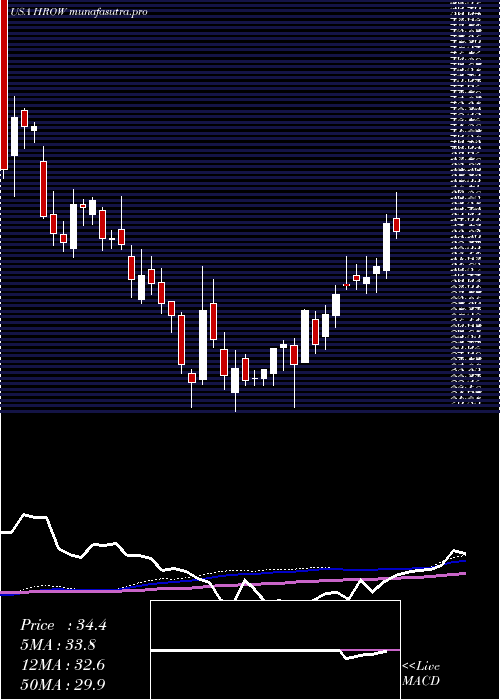
Weekly price and charts HarrowHealth Strong weekly Stock price targets for HarrowHealth HROW are 38.54 and 42.66 | Weekly Target 1 | 35.15 | | Weekly Target 2 | 37.81 | | Weekly Target 3 | 39.266666666667 | | Weekly Target 4 | 41.93 | | Weekly Target 5 | 43.39 |
Weekly price and volumes for Harrow Health
| Date |
Closing |
Open |
Range |
Volume |
Fri 17 October 2025 |
40.48 (8%) |
38.00 |
36.60 - 40.72 |
0.9187 times |
Fri 10 October 2025 |
37.48 (-17.5%) |
45.70 |
37.39 - 46.03 |
2.1308 times |
Fri 03 October 2025 |
45.43 (-3.55%) |
49.54 |
44.94 - 50.39 |
1.3266 times |
Fri 26 September 2025 |
47.10 (6.22%) |
43.95 |
43.50 - 50.72 |
1.3057 times |
Fri 19 September 2025 |
44.34 (12.48%) |
40.06 |
40.06 - 45.85 |
1.3932 times |
Fri 12 September 2025 |
39.42 (6.57%) |
38.80 |
38.25 - 41.25 |
0.809 times |
Fri 05 September 2025 |
36.99 (-5.15%) |
38.45 |
35.62 - 38.87 |
0.5007 times |
Fri 29 August 2025 |
39.00 (0%) |
39.44 |
38.33 - 39.70 |
0.1111 times |
Fri 29 August 2025 |
39.00 (-0.31%) |
39.19 |
37.09 - 39.70 |
0.6641 times |
Fri 22 August 2025 |
39.12 (0.77%) |
39.05 |
36.55 - 40.40 |
0.84 times |
Fri 15 August 2025 |
38.82 (12.75%) |
34.64 |
29.75 - 40.61 |
2.1301 times |
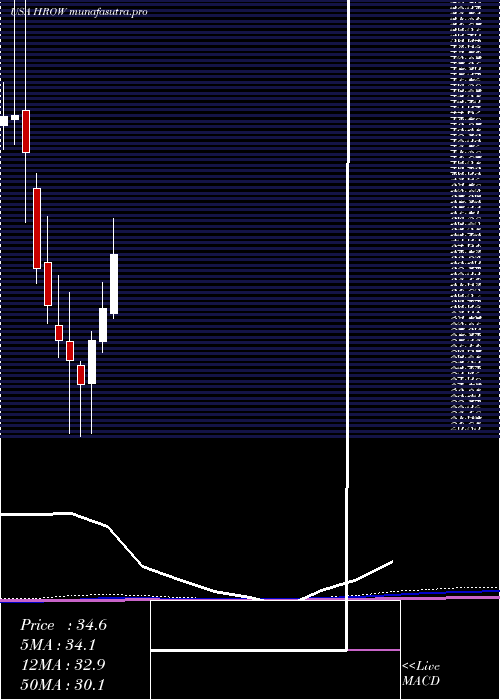
Monthly price and charts HarrowHealth Strong monthly Stock price targets for HarrowHealth HROW are 32.45 and 44.64 | Monthly Target 1 | 29.77 | | Monthly Target 2 | 35.12 | | Monthly Target 3 | 41.956666666667 | | Monthly Target 4 | 47.31 | | Monthly Target 5 | 54.15 |
Monthly price and volumes Harrow Health
| Date |
Closing |
Open |
Range |
Volume |
Fri 17 October 2025 |
40.48 (-15.98%) |
48.03 |
36.60 - 48.79 |
1.1219 times |
Tue 30 September 2025 |
48.18 (23.54%) |
38.45 |
35.62 - 50.72 |
1.4071 times |
Fri 29 August 2025 |
39.00 (22.8%) |
31.05 |
29.75 - 40.61 |
1.314 times |
Thu 31 July 2025 |
31.76 (3.99%) |
30.15 |
29.78 - 38.09 |
0.9443 times |
Mon 30 June 2025 |
30.54 (8.64%) |
28.03 |
27.17 - 32.46 |
0.7699 times |
Fri 30 May 2025 |
28.11 (13.48%) |
24.84 |
21.12 - 28.79 |
0.9985 times |
Wed 30 April 2025 |
24.77 (-6.88%) |
26.25 |
20.85 - 26.51 |
0.8971 times |
Mon 31 March 2025 |
26.60 (-5.27%) |
28.06 |
21.14 - 31.74 |
1.2772 times |
Fri 28 February 2025 |
28.08 (-8.59%) |
29.25 |
26.79 - 32.97 |
0.5954 times |
Fri 31 January 2025 |
30.72 (-8.44%) |
33.95 |
29.37 - 37.47 |
0.6746 times |
Tue 31 December 2024 |
33.55 (-20.57%) |
39.57 |
32.40 - 40.70 |
0.492 times |
DMA SMA EMA moving averages of Harrow Health HROW
DMA (daily moving average) of Harrow Health HROW
| DMA period | DMA value | | 5 day DMA | 39.07 | | 12 day DMA | 40.92 | | 20 day DMA | 43.6 | | 35 day DMA | 42.13 | | 50 day DMA | 40.87 | | 100 day DMA | 36.45 | | 150 day DMA | 32.65 | | 200 day DMA | 32.31 | EMA (exponential moving average) of Harrow Health HROW
| EMA period | EMA current | EMA prev | EMA prev2 | | 5 day EMA | 39.4 | 38.86 | 39.65 | | 12 day EMA | 40.7 | 40.74 | 41.37 | | 20 day EMA | 41.45 | 41.55 | 42 | | 35 day EMA | 41.07 | 41.11 | 41.34 | | 50 day EMA | 40.06 | 40.04 | 40.15 |
SMA (simple moving average) of Harrow Health HROW
| SMA period | SMA current | SMA prev | SMA prev2 | | 5 day SMA | 39.07 | 38.47 | 39.12 | | 12 day SMA | 40.92 | 41.58 | 42.48 | | 20 day SMA | 43.6 | 43.79 | 44.2 | | 35 day SMA | 42.13 | 42.09 | 42.14 | | 50 day SMA | 40.87 | 40.75 | 40.66 | | 100 day SMA | 36.45 | 36.3 | 36.19 | | 150 day SMA | 32.65 | 32.54 | 32.44 | | 200 day SMA | 32.31 | 32.27 | 32.26 |
|
|
