HercHoldings HRI full analysis,charts,indicators,moving averages,SMA,DMA,EMA,ADX,MACD,RSIHerc Holdings HRI WideScreen charts, DMA,SMA,EMA technical analysis, forecast prediction, by indicators ADX,MACD,RSI,CCI USA stock exchange
operates under N A sector & deals in N A
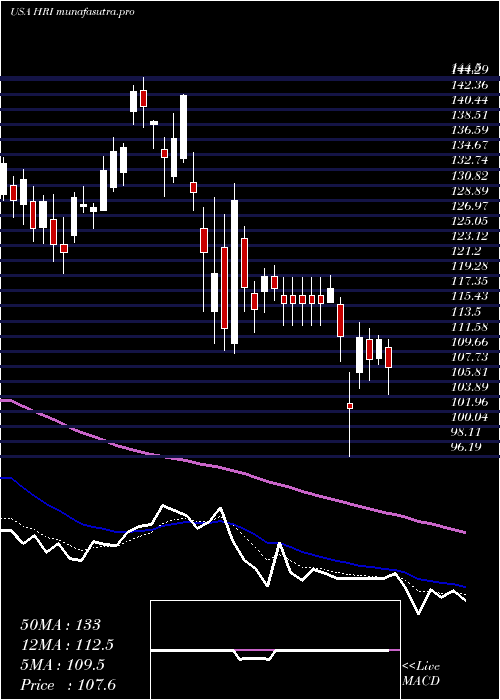
Daily price and charts and targets HercHoldings Strong Daily Stock price targets for HercHoldings HRI are 127.15 and 131.89 | Daily Target 1 | 123.58 | | Daily Target 2 | 125.97 | | Daily Target 3 | 128.32333333333 | | Daily Target 4 | 130.71 | | Daily Target 5 | 133.06 |
Daily price and volume Herc Holdings
| Date |
Closing |
Open |
Range |
Volume |
Mon 20 October 2025 |
128.35 (2.49%) |
127.64 |
125.94 - 130.68 |
0.6504 times |
Fri 17 October 2025 |
125.23 (-3.19%) |
127.90 |
122.08 - 129.71 |
1.1835 times |
Thu 16 October 2025 |
129.35 (2.17%) |
127.21 |
125.83 - 129.96 |
0.7612 times |
Wed 15 October 2025 |
126.60 (-1.1%) |
125.45 |
125.45 - 129.69 |
1.3357 times |
Tue 14 October 2025 |
128.01 (6.07%) |
118.87 |
118.12 - 131.67 |
1.1211 times |
Mon 13 October 2025 |
120.69 (-0.6%) |
120.17 |
117.91 - 121.47 |
0.6656 times |
Tue 07 October 2025 |
121.42 (-3.92%) |
127.00 |
121.20 - 128.91 |
1.7178 times |
Mon 06 October 2025 |
126.38 (-1.41%) |
128.32 |
124.31 - 128.52 |
0.5737 times |
Fri 03 October 2025 |
128.19 (3.6%) |
124.50 |
124.50 - 131.85 |
1.4701 times |
Thu 02 October 2025 |
123.73 (2.83%) |
119.81 |
119.81 - 124.50 |
0.5209 times |
Wed 01 October 2025 |
120.33 (3.15%) |
118.53 |
118.53 - 122.78 |
1.3162 times |
Weekly price and charts HercHoldings Strong weekly Stock price targets for HercHoldings HRI are 127.15 and 131.89 | Weekly Target 1 | 123.58 | | Weekly Target 2 | 125.97 | | Weekly Target 3 | 128.32333333333 | | Weekly Target 4 | 130.71 | | Weekly Target 5 | 133.06 |
Weekly price and volumes for Herc Holdings
| Date |
Closing |
Open |
Range |
Volume |
Mon 20 October 2025 |
128.35 (2.49%) |
127.64 |
125.94 - 130.68 |
0.1644 times |
Fri 17 October 2025 |
125.23 (3.14%) |
120.17 |
117.91 - 131.67 |
1.2805 times |
Tue 07 October 2025 |
121.42 (-5.28%) |
128.32 |
121.20 - 128.91 |
0.5791 times |
Fri 03 October 2025 |
128.19 (7.84%) |
119.18 |
113.25 - 131.85 |
1.3789 times |
Fri 26 September 2025 |
118.87 (-0.19%) |
118.05 |
116.14 - 127.51 |
1.1705 times |
Fri 19 September 2025 |
119.10 (-5.83%) |
127.22 |
118.91 - 136.13 |
1.9124 times |
Fri 12 September 2025 |
126.48 (-8.66%) |
138.06 |
124.83 - 138.09 |
1.3654 times |
Fri 05 September 2025 |
138.47 (5.87%) |
128.43 |
124.59 - 139.70 |
0.981 times |
Fri 29 August 2025 |
130.79 (0%) |
132.20 |
130.19 - 132.94 |
0.171 times |
Fri 29 August 2025 |
130.79 (0.81%) |
130.51 |
127.35 - 134.26 |
0.997 times |
Fri 22 August 2025 |
129.74 (3.99%) |
125.32 |
117.70 - 130.55 |
1.4158 times |
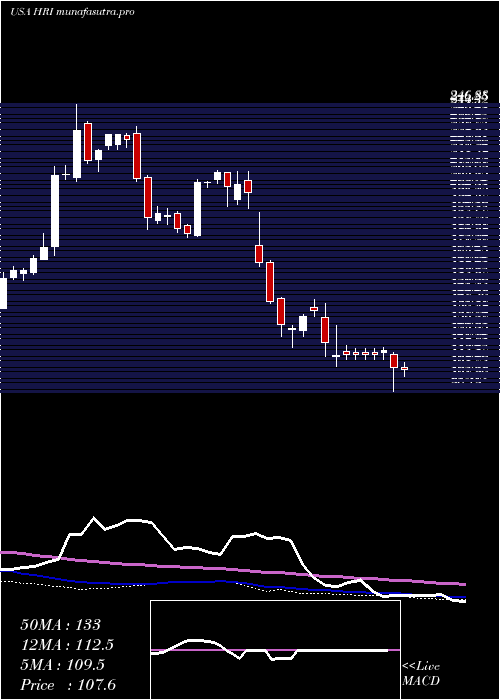
Monthly price and charts HercHoldings Strong monthly Stock price targets for HercHoldings HRI are 123.13 and 137.07 | Monthly Target 1 | 112.1 | | Monthly Target 2 | 120.22 | | Monthly Target 3 | 126.03666666667 | | Monthly Target 4 | 134.16 | | Monthly Target 5 | 139.98 |
Monthly price and volumes Herc Holdings
| Date |
Closing |
Open |
Range |
Volume |
Mon 20 October 2025 |
128.35 (10.02%) |
118.53 |
117.91 - 131.85 |
0.4842 times |
Tue 30 September 2025 |
116.66 (-10.8%) |
128.43 |
113.25 - 139.70 |
1.0113 times |
Fri 29 August 2025 |
130.79 (11.97%) |
113.22 |
108.89 - 134.26 |
0.9216 times |
Thu 31 July 2025 |
116.81 (-11.3%) |
131.24 |
114.02 - 153.23 |
1.4773 times |
Mon 30 June 2025 |
131.69 (6.2%) |
124.35 |
110.80 - 132.50 |
0.9267 times |
Fri 30 May 2025 |
124.00 (13.3%) |
110.37 |
109.11 - 139.26 |
1.0402 times |
Wed 30 April 2025 |
109.44 (-18.49%) |
131.94 |
96.19 - 142.40 |
1.05 times |
Mon 31 March 2025 |
134.27 (-6.42%) |
145.11 |
119.60 - 145.82 |
1.1936 times |
Fri 28 February 2025 |
143.48 (-29.65%) |
196.95 |
142.19 - 211.88 |
1.1938 times |
Fri 31 January 2025 |
203.96 (7.73%) |
192.20 |
176.87 - 212.19 |
0.7012 times |
Tue 31 December 2024 |
189.33 (-18.04%) |
230.80 |
181.25 - 235.40 |
0.5381 times |

DMA SMA EMA moving averages of Herc Holdings HRI
DMA (daily moving average) of Herc Holdings HRI
| DMA period | DMA value | | 5 day DMA | 127.51 | | 12 day DMA | 124.58 | | 20 day DMA | 123.28 | | 35 day DMA | 126.72 | | 50 day DMA | 125.61 | | 100 day DMA | 127.16 | | 150 day DMA | 125.94 | | 200 day DMA | 139.7 | EMA (exponential moving average) of Herc Holdings HRI
| EMA period | EMA current | EMA prev | EMA prev2 | | 5 day EMA | 126.82 | 126.06 | 126.48 | | 12 day EMA | 125.42 | 124.89 | 124.83 | | 20 day EMA | 125.06 | 124.71 | 124.65 | | 35 day EMA | 124.46 | 124.23 | 124.17 | | 50 day EMA | 125.03 | 124.89 | 124.88 |
SMA (simple moving average) of Herc Holdings HRI
| SMA period | SMA current | SMA prev | SMA prev2 | | 5 day SMA | 127.51 | 125.98 | 125.21 | | 12 day SMA | 124.58 | 123.36 | 122.83 | | 20 day SMA | 123.28 | 123.25 | 123.6 | | 35 day SMA | 126.72 | 126.84 | 126.93 | | 50 day SMA | 125.61 | 125.37 | 125.19 | | 100 day SMA | 127.16 | 127.13 | 127.23 | | 150 day SMA | 125.94 | 125.91 | 125.93 | | 200 day SMA | 139.7 | 140 | 140.33 |
|
|
