TeklaHealthcare HQH full analysis,charts,indicators,moving averages,SMA,DMA,EMA,ADX,MACD,RSITekla Healthcare HQH WideScreen charts, DMA,SMA,EMA technical analysis, forecast prediction, by indicators ADX,MACD,RSI,CCI USA stock exchange
operates under N A sector & deals in N A
Daily price and charts and targets TeklaHealthcare Strong Daily Stock price targets for TeklaHealthcare HQH are 18.85 and 19.19 | Daily Target 1 | 18.58 | | Daily Target 2 | 18.78 | | Daily Target 3 | 18.923333333333 | | Daily Target 4 | 19.12 | | Daily Target 5 | 19.26 |
Daily price and volume Tekla Healthcare
| Date |
Closing |
Open |
Range |
Volume |
Thu 04 December 2025 |
18.97 (0.69%) |
18.73 |
18.73 - 19.07 |
0.8306 times |
Wed 03 December 2025 |
18.84 (0.69%) |
18.65 |
18.65 - 18.95 |
1.0151 times |
Tue 02 December 2025 |
18.71 (-1.21%) |
18.99 |
18.70 - 19.24 |
0.9373 times |
Mon 01 December 2025 |
18.94 (-3.02%) |
19.51 |
18.94 - 19.51 |
0.9769 times |
Fri 28 November 2025 |
19.53 (0.21%) |
19.65 |
19.42 - 19.65 |
0.4375 times |
Wed 26 November 2025 |
19.49 (0.57%) |
19.47 |
19.38 - 19.60 |
1.1276 times |
Tue 25 November 2025 |
19.38 (1.31%) |
19.25 |
19.14 - 19.41 |
1.1502 times |
Mon 24 November 2025 |
19.13 (3.29%) |
18.66 |
18.54 - 19.20 |
1.804 times |
Fri 21 November 2025 |
18.52 (-0.48%) |
18.04 |
17.88 - 18.60 |
0.7664 times |
Thu 20 November 2025 |
18.61 (-1.17%) |
18.91 |
18.56 - 19.18 |
0.9544 times |
Wed 19 November 2025 |
18.83 (-0.26%) |
18.83 |
18.75 - 19.00 |
0.9201 times |
Weekly price and charts TeklaHealthcare Strong weekly Stock price targets for TeklaHealthcare HQH are 18.38 and 19.24 | Weekly Target 1 | 18.18 | | Weekly Target 2 | 18.58 | | Weekly Target 3 | 19.043333333333 | | Weekly Target 4 | 19.44 | | Weekly Target 5 | 19.9 |
Weekly price and volumes for Tekla Healthcare
| Date |
Closing |
Open |
Range |
Volume |
Thu 04 December 2025 |
18.97 (-2.87%) |
19.51 |
18.65 - 19.51 |
0.9758 times |
Fri 28 November 2025 |
19.53 (5.45%) |
18.66 |
18.54 - 19.65 |
1.173 times |
Fri 21 November 2025 |
18.52 (-1.07%) |
18.79 |
17.88 - 19.18 |
1.3615 times |
Fri 14 November 2025 |
18.72 (5.41%) |
17.78 |
17.75 - 18.95 |
1.4528 times |
Fri 07 November 2025 |
17.76 (-9.8%) |
18.59 |
17.52 - 18.65 |
1.2388 times |
Fri 31 October 2025 |
19.69 (0%) |
19.61 |
19.44 - 19.69 |
0.1942 times |
Fri 31 October 2025 |
19.69 (3.69%) |
19.04 |
19.04 - 19.69 |
0.9183 times |
Fri 24 October 2025 |
18.99 (0.11%) |
18.98 |
18.68 - 19.40 |
0.9911 times |
Fri 17 October 2025 |
18.97 (2.15%) |
18.80 |
18.70 - 19.45 |
1.2269 times |
Tue 07 October 2025 |
18.57 (-0.32%) |
18.63 |
18.32 - 18.66 |
0.4677 times |
Fri 03 October 2025 |
18.63 (4.84%) |
17.80 |
17.68 - 18.79 |
1.4547 times |

Monthly price and charts TeklaHealthcare Strong monthly Stock price targets for TeklaHealthcare HQH are 18.38 and 19.24 | Monthly Target 1 | 18.18 | | Monthly Target 2 | 18.58 | | Monthly Target 3 | 19.043333333333 | | Monthly Target 4 | 19.44 | | Monthly Target 5 | 19.9 |
Monthly price and volumes Tekla Healthcare
| Date |
Closing |
Open |
Range |
Volume |
Thu 04 December 2025 |
18.97 (-2.87%) |
19.51 |
18.65 - 19.51 |
0.202 times |
Fri 28 November 2025 |
19.53 (-0.81%) |
18.59 |
17.52 - 19.65 |
1.0819 times |
Fri 31 October 2025 |
19.69 (6.66%) |
18.46 |
18.25 - 19.69 |
0.9545 times |
Tue 30 September 2025 |
18.46 (11.61%) |
16.47 |
16.36 - 18.46 |
0.9876 times |
Fri 29 August 2025 |
16.54 (5.69%) |
15.65 |
15.51 - 16.90 |
1.1745 times |
Thu 31 July 2025 |
15.65 (1.03%) |
15.49 |
15.48 - 16.36 |
1.3615 times |
Mon 30 June 2025 |
15.49 (1.77%) |
15.26 |
15.09 - 16.04 |
0.862 times |
Fri 30 May 2025 |
15.22 (-6.28%) |
16.37 |
15.11 - 16.42 |
1.3813 times |
Wed 30 April 2025 |
16.24 (0%) |
16.20 |
13.77 - 16.32 |
1.1906 times |
Mon 31 March 2025 |
16.24 (-5.58%) |
17.27 |
15.90 - 17.33 |
0.804 times |
Fri 28 February 2025 |
17.20 (-5.29%) |
17.99 |
16.95 - 18.30 |
1.0364 times |

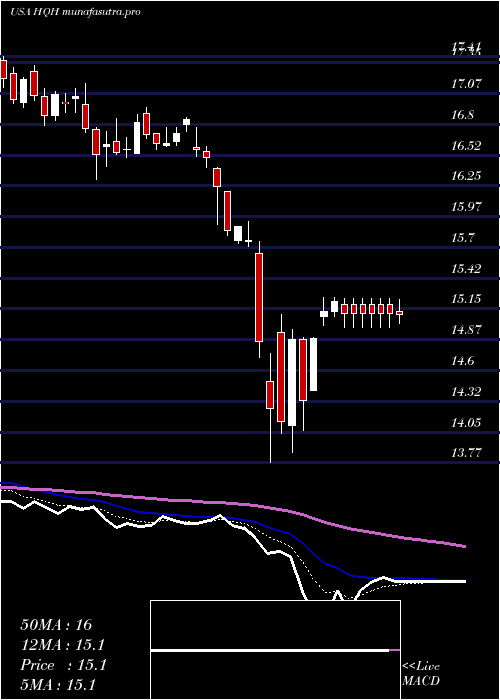
DMA SMA EMA moving averages of Tekla Healthcare HQH
DMA (daily moving average) of Tekla Healthcare HQH
| DMA period | DMA value | | 5 day DMA | 19 | | 12 day DMA | 18.99 | | 20 day DMA | 18.76 | | 35 day DMA | 18.91 | | 50 day DMA | 18.67 | | 100 day DMA | 17.46 | | 150 day DMA | 16.85 | | 200 day DMA | 16.69 | EMA (exponential moving average) of Tekla Healthcare HQH
| EMA period | EMA current | EMA prev | EMA prev2 | | 5 day EMA | 18.96 | 18.96 | 19.02 | | 12 day EMA | 18.94 | 18.94 | 18.96 | | 20 day EMA | 18.89 | 18.88 | 18.88 | | 35 day EMA | 18.68 | 18.66 | 18.65 | | 50 day EMA | 18.54 | 18.52 | 18.51 |
SMA (simple moving average) of Tekla Healthcare HQH
| SMA period | SMA current | SMA prev | SMA prev2 | | 5 day SMA | 19 | 19.1 | 19.21 | | 12 day SMA | 18.99 | 18.98 | 18.97 | | 20 day SMA | 18.76 | 18.71 | 18.68 | | 35 day SMA | 18.91 | 18.91 | 18.91 | | 50 day SMA | 18.67 | 18.63 | 18.59 | | 100 day SMA | 17.46 | 17.43 | 17.41 | | 150 day SMA | 16.85 | 16.83 | 16.81 | | 200 day SMA | 16.69 | 16.68 | 16.68 |
|
|
