JohnHancock HPS full analysis,charts,indicators,moving averages,SMA,DMA,EMA,ADX,MACD,RSIJohn Hancock HPS WideScreen charts, DMA,SMA,EMA technical analysis, forecast prediction, by indicators ADX,MACD,RSI,CCI USA stock exchange
operates under N A sector & deals in N A
Daily price and charts and targets JohnHancock Strong Daily Stock price targets for JohnHancock HPS are 14.59 and 14.74 | Daily Target 1 | 14.56 | | Daily Target 2 | 14.61 | | Daily Target 3 | 14.71 | | Daily Target 4 | 14.76 | | Daily Target 5 | 14.86 |
Daily price and volume John Hancock
| Date |
Closing |
Open |
Range |
Volume |
Thu 04 December 2025 |
14.66 (-0.74%) |
14.81 |
14.66 - 14.81 |
1.5476 times |
Wed 03 December 2025 |
14.77 (-0.81%) |
14.81 |
14.77 - 14.87 |
1.3273 times |
Tue 02 December 2025 |
14.89 (0.34%) |
14.84 |
14.84 - 14.96 |
0.8058 times |
Mon 01 December 2025 |
14.84 (-0.93%) |
14.88 |
14.81 - 15.00 |
0.9256 times |
Fri 28 November 2025 |
14.98 (0.33%) |
15.03 |
14.88 - 15.03 |
0.7647 times |
Wed 26 November 2025 |
14.93 (0.13%) |
14.89 |
14.85 - 14.95 |
0.8993 times |
Tue 25 November 2025 |
14.91 (0.61%) |
14.74 |
14.74 - 14.94 |
0.4383 times |
Mon 24 November 2025 |
14.82 (1.37%) |
14.69 |
14.69 - 14.93 |
1.1801 times |
Fri 21 November 2025 |
14.62 (-1.02%) |
14.72 |
14.62 - 14.86 |
1.5293 times |
Thu 20 November 2025 |
14.77 (-0.94%) |
14.93 |
14.75 - 15.00 |
0.5821 times |
Wed 19 November 2025 |
14.91 (-0.33%) |
14.92 |
14.85 - 14.99 |
0.5638 times |
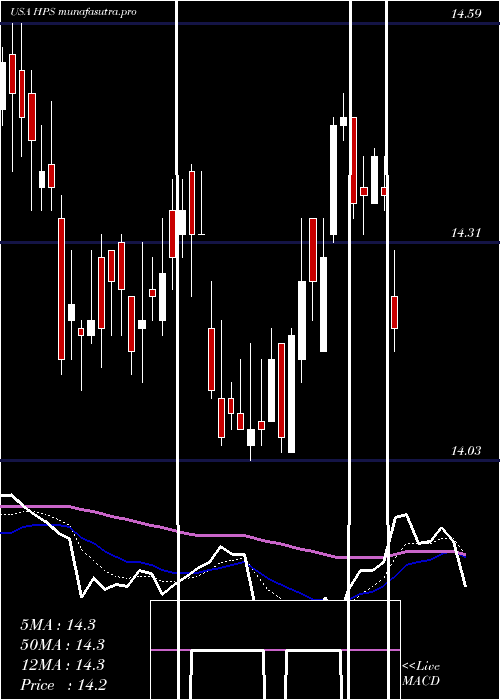
Weekly price and charts JohnHancock Strong weekly Stock price targets for JohnHancock HPS are 14.49 and 14.83 | Weekly Target 1 | 14.43 | | Weekly Target 2 | 14.55 | | Weekly Target 3 | 14.773333333333 | | Weekly Target 4 | 14.89 | | Weekly Target 5 | 15.11 |
Weekly price and volumes for John Hancock
| Date |
Closing |
Open |
Range |
Volume |
Thu 04 December 2025 |
14.66 (-2.14%) |
14.88 |
14.66 - 15.00 |
1.6374 times |
Fri 28 November 2025 |
14.98 (2.46%) |
14.69 |
14.69 - 15.03 |
1.1668 times |
Fri 21 November 2025 |
14.62 (-2.73%) |
15.03 |
14.62 - 15.09 |
1.4025 times |
Fri 14 November 2025 |
15.03 (-2.21%) |
15.44 |
14.99 - 15.54 |
1.1315 times |
Fri 07 November 2025 |
15.37 (-0.45%) |
15.40 |
15.25 - 15.48 |
0.7242 times |
Fri 31 October 2025 |
15.44 (0%) |
15.50 |
15.38 - 15.50 |
0.3623 times |
Fri 31 October 2025 |
15.44 (0.13%) |
15.53 |
15.32 - 15.53 |
1.2386 times |
Fri 24 October 2025 |
15.42 (1.11%) |
15.26 |
15.26 - 15.54 |
1.0799 times |
Fri 17 October 2025 |
15.25 (-2.37%) |
15.29 |
15.12 - 15.44 |
0.8487 times |
Tue 07 October 2025 |
15.62 (0.26%) |
15.64 |
15.54 - 15.68 |
0.4083 times |
Fri 03 October 2025 |
15.58 (1.9%) |
15.33 |
15.23 - 15.66 |
1.9845 times |
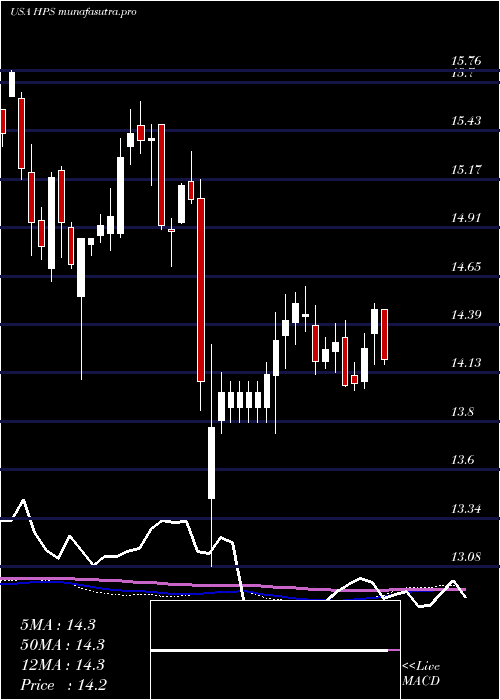
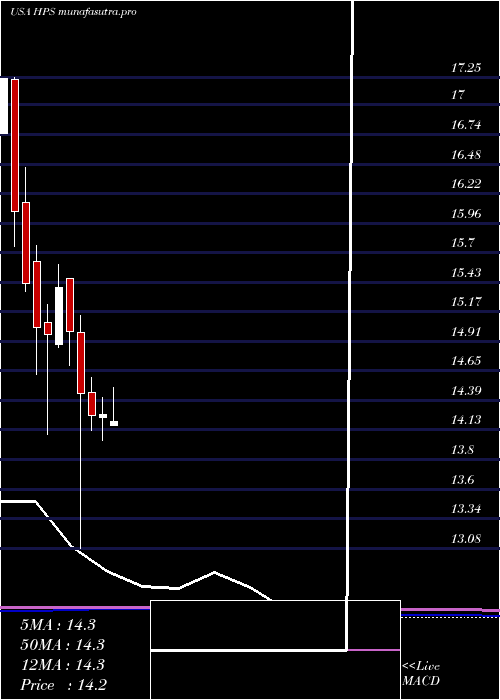
Monthly price and charts JohnHancock Strong monthly Stock price targets for JohnHancock HPS are 14.49 and 14.83 | Monthly Target 1 | 14.43 | | Monthly Target 2 | 14.55 | | Monthly Target 3 | 14.773333333333 | | Monthly Target 4 | 14.89 | | Monthly Target 5 | 15.11 |
Monthly price and volumes John Hancock
| Date |
Closing |
Open |
Range |
Volume |
Thu 04 December 2025 |
14.66 (-2.14%) |
14.88 |
14.66 - 15.00 |
0.3323 times |
Fri 28 November 2025 |
14.98 (-2.98%) |
15.40 |
14.62 - 15.54 |
0.8979 times |
Fri 31 October 2025 |
15.44 (0%) |
15.44 |
15.12 - 15.68 |
1.0124 times |
Tue 30 September 2025 |
15.44 (4.47%) |
14.75 |
14.75 - 15.56 |
1.2429 times |
Fri 29 August 2025 |
14.78 (2.78%) |
14.40 |
14.38 - 14.91 |
1.2019 times |
Thu 31 July 2025 |
14.38 (0.84%) |
14.17 |
14.04 - 14.50 |
1.6209 times |
Mon 30 June 2025 |
14.26 (0.07%) |
14.24 |
14.03 - 14.41 |
0.9158 times |
Fri 30 May 2025 |
14.25 (-1.38%) |
14.46 |
14.12 - 14.59 |
0.8562 times |
Wed 30 April 2025 |
14.45 (-3.67%) |
14.99 |
13.08 - 15.14 |
1.0012 times |
Mon 31 March 2025 |
15.00 (-2.53%) |
15.47 |
14.70 - 15.47 |
0.9185 times |
Fri 28 February 2025 |
15.39 (2.81%) |
14.88 |
14.86 - 15.59 |
1.0455 times |
DMA SMA EMA moving averages of John Hancock HPS
DMA (daily moving average) of John Hancock HPS
| DMA period | DMA value | | 5 day DMA | 14.83 | | 12 day DMA | 14.84 | | 20 day DMA | 15.01 | | 35 day DMA | 15.17 | | 50 day DMA | 15.25 | | 100 day DMA | 14.95 | | 150 day DMA | 14.73 | | 200 day DMA | 14.73 | EMA (exponential moving average) of John Hancock HPS
| EMA period | EMA current | EMA prev | EMA prev2 | | 5 day EMA | 14.79 | 14.85 | 14.89 | | 12 day EMA | 14.88 | 14.92 | 14.95 | | 20 day EMA | 14.98 | 15.01 | 15.03 | | 35 day EMA | 15.08 | 15.1 | 15.12 | | 50 day EMA | 15.21 | 15.23 | 15.25 |
SMA (simple moving average) of John Hancock HPS
| SMA period | SMA current | SMA prev | SMA prev2 | | 5 day SMA | 14.83 | 14.88 | 14.91 | | 12 day SMA | 14.84 | 14.86 | 14.88 | | 20 day SMA | 15.01 | 15.04 | 15.07 | | 35 day SMA | 15.17 | 15.19 | 15.2 | | 50 day SMA | 15.25 | 15.26 | 15.27 | | 100 day SMA | 14.95 | 14.95 | 14.94 | | 150 day SMA | 14.73 | 14.73 | 14.73 | | 200 day SMA | 14.73 | 14.73 | 14.73 |
|
|
