HopeBancorp HOPE full analysis,charts,indicators,moving averages,SMA,DMA,EMA,ADX,MACD,RSIHope Bancorp HOPE WideScreen charts, DMA,SMA,EMA technical analysis, forecast prediction, by indicators ADX,MACD,RSI,CCI USA stock exchange
operates under Finance sector & deals in Major Banks
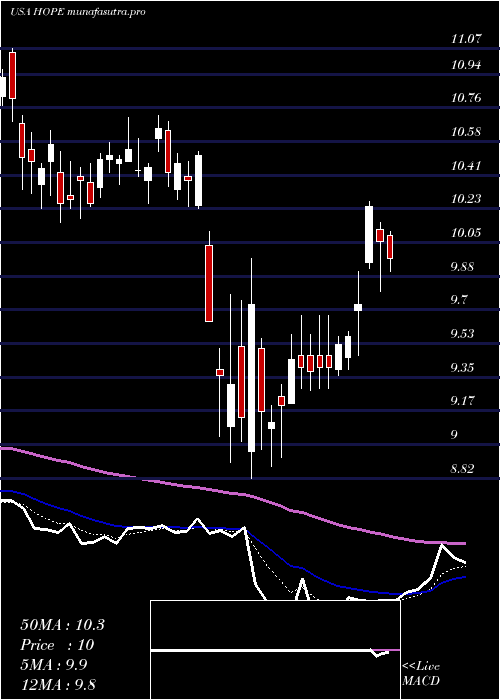
Daily price and charts and targets HopeBancorp Strong Daily Stock price targets for HopeBancorp HOPE are 10.87 and 11.01 | Daily Target 1 | 10.76 | | Daily Target 2 | 10.84 | | Daily Target 3 | 10.896666666667 | | Daily Target 4 | 10.98 | | Daily Target 5 | 11.04 |
Daily price and volume Hope Bancorp
| Date |
Closing |
Open |
Range |
Volume |
Thu 04 December 2025 |
10.93 (-0.09%) |
10.85 |
10.81 - 10.95 |
0.7904 times |
Wed 03 December 2025 |
10.94 (1.77%) |
10.79 |
10.77 - 10.99 |
0.8349 times |
Tue 02 December 2025 |
10.75 (-0.46%) |
10.85 |
10.72 - 10.91 |
0.9328 times |
Mon 01 December 2025 |
10.80 (1.69%) |
10.54 |
10.54 - 10.83 |
1.5291 times |
Fri 28 November 2025 |
10.62 (-0.84%) |
10.68 |
10.56 - 10.70 |
0.4672 times |
Wed 26 November 2025 |
10.71 (0.28%) |
10.62 |
10.57 - 10.81 |
1.6485 times |
Tue 25 November 2025 |
10.68 (2.79%) |
10.45 |
10.42 - 10.79 |
1.2635 times |
Mon 24 November 2025 |
10.39 (0.39%) |
10.35 |
10.23 - 10.44 |
0.7705 times |
Fri 21 November 2025 |
10.35 (3.81%) |
9.99 |
9.98 - 10.47 |
0.9609 times |
Thu 20 November 2025 |
9.97 (0.1%) |
10.03 |
9.92 - 10.23 |
0.8022 times |
Wed 19 November 2025 |
9.96 (0.5%) |
9.89 |
9.81 - 10.02 |
0.8108 times |
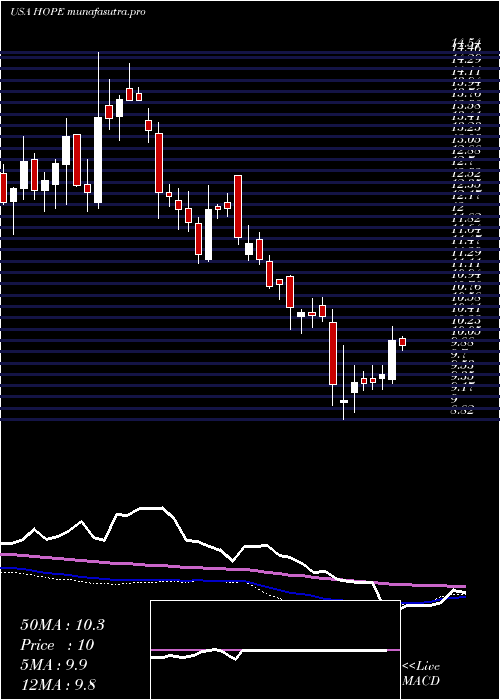
Weekly price and charts HopeBancorp Strong weekly Stock price targets for HopeBancorp HOPE are 10.74 and 11.19 | Weekly Target 1 | 10.37 | | Weekly Target 2 | 10.65 | | Weekly Target 3 | 10.82 | | Weekly Target 4 | 11.1 | | Weekly Target 5 | 11.27 |
Weekly price and volumes for Hope Bancorp
| Date |
Closing |
Open |
Range |
Volume |
Thu 04 December 2025 |
10.93 (2.92%) |
10.54 |
10.54 - 10.99 |
1.0402 times |
Fri 28 November 2025 |
10.62 (2.61%) |
10.35 |
10.23 - 10.81 |
1.0561 times |
Fri 21 November 2025 |
10.35 (0.58%) |
10.23 |
9.80 - 10.47 |
1.2414 times |
Fri 14 November 2025 |
10.29 (-1.63%) |
10.49 |
10.17 - 10.58 |
1.2261 times |
Fri 07 November 2025 |
10.46 (-0.29%) |
10.46 |
10.27 - 10.68 |
0.8567 times |
Fri 31 October 2025 |
10.49 (0%) |
10.45 |
10.33 - 10.52 |
0.2593 times |
Fri 31 October 2025 |
10.49 (-2.24%) |
10.75 |
10.33 - 11.03 |
1.2601 times |
Fri 24 October 2025 |
10.73 (4.89%) |
10.28 |
10.25 - 10.81 |
0.8076 times |
Fri 17 October 2025 |
10.23 (-2.48%) |
10.62 |
9.99 - 11.14 |
1.0469 times |
Fri 10 October 2025 |
10.49 (-2.69%) |
10.91 |
10.49 - 11.26 |
1.2056 times |
Fri 03 October 2025 |
10.78 (-0.92%) |
10.92 |
10.55 - 10.92 |
0.9226 times |
Monthly price and charts HopeBancorp Strong monthly Stock price targets for HopeBancorp HOPE are 10.74 and 11.19 | Monthly Target 1 | 10.37 | | Monthly Target 2 | 10.65 | | Monthly Target 3 | 10.82 | | Monthly Target 4 | 11.1 | | Monthly Target 5 | 11.27 |
Monthly price and volumes Hope Bancorp
| Date |
Closing |
Open |
Range |
Volume |
Thu 04 December 2025 |
10.93 (2.92%) |
10.54 |
10.54 - 10.99 |
0.2102 times |
Fri 28 November 2025 |
10.62 (1.24%) |
10.46 |
9.80 - 10.81 |
0.8851 times |
Fri 31 October 2025 |
10.49 (-2.6%) |
10.73 |
9.99 - 11.26 |
1.022 times |
Tue 30 September 2025 |
10.77 (-3.23%) |
10.98 |
10.58 - 11.40 |
0.8176 times |
Fri 29 August 2025 |
11.13 (11.41%) |
9.69 |
9.44 - 11.29 |
1.0265 times |
Thu 31 July 2025 |
9.99 (-6.9%) |
10.62 |
9.96 - 11.75 |
1.2673 times |
Mon 30 June 2025 |
10.73 (6.87%) |
9.98 |
9.81 - 10.95 |
0.9409 times |
Fri 30 May 2025 |
10.04 (0.7%) |
10.00 |
9.84 - 10.72 |
1.0284 times |
Wed 30 April 2025 |
9.97 (-4.78%) |
10.40 |
8.82 - 10.53 |
1.8731 times |
Mon 31 March 2025 |
10.47 (-4.12%) |
11.05 |
10.16 - 11.07 |
0.9288 times |
Fri 28 February 2025 |
10.92 (-6.35%) |
11.40 |
10.70 - 11.85 |
0.6528 times |

DMA SMA EMA moving averages of Hope Bancorp HOPE
DMA (daily moving average) of Hope Bancorp HOPE
| DMA period | DMA value | | 5 day DMA | 10.81 | | 12 day DMA | 10.5 | | 20 day DMA | 10.44 | | 35 day DMA | 10.48 | | 50 day DMA | 10.58 | | 100 day DMA | 10.65 | | 150 day DMA | 10.61 | | 200 day DMA | 10.5 | EMA (exponential moving average) of Hope Bancorp HOPE
| EMA period | EMA current | EMA prev | EMA prev2 | | 5 day EMA | 10.81 | 10.75 | 10.66 | | 12 day EMA | 10.63 | 10.58 | 10.51 | | 20 day EMA | 10.56 | 10.52 | 10.48 | | 35 day EMA | 10.56 | 10.54 | 10.52 | | 50 day EMA | 10.63 | 10.62 | 10.61 |
SMA (simple moving average) of Hope Bancorp HOPE
| SMA period | SMA current | SMA prev | SMA prev2 | | 5 day SMA | 10.81 | 10.76 | 10.71 | | 12 day SMA | 10.5 | 10.41 | 10.36 | | 20 day SMA | 10.44 | 10.42 | 10.39 | | 35 day SMA | 10.48 | 10.47 | 10.48 | | 50 day SMA | 10.58 | 10.58 | 10.58 | | 100 day SMA | 10.65 | 10.66 | 10.66 | | 150 day SMA | 10.61 | 10.6 | 10.6 | | 200 day SMA | 10.5 | 10.5 | 10.51 |
|
|
