HoneywellInternational HON full analysis,charts,indicators,moving averages,SMA,DMA,EMA,ADX,MACD,RSIHoneywell International HON WideScreen charts, DMA,SMA,EMA technical analysis, forecast prediction, by indicators ADX,MACD,RSI,CCI USA stock exchange
operates under Capital Goods sector & deals in Auto Parts O E M
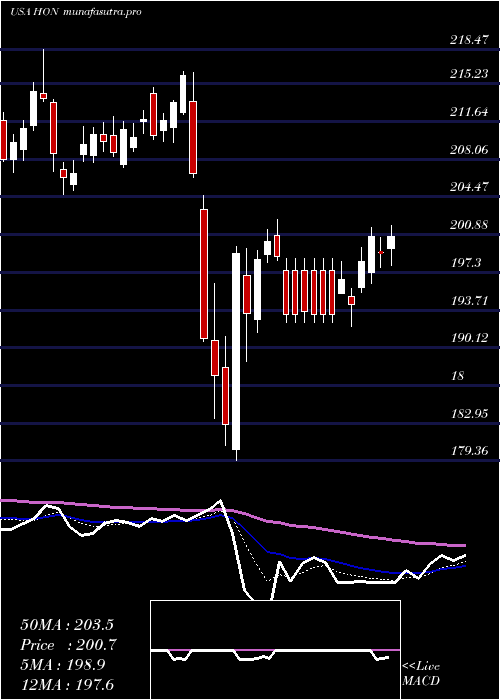
Daily price and charts and targets HoneywellInternational Strong Daily Stock price targets for HoneywellInternational HON are 190.62 and 193.08 | Daily Target 1 | 190.08 | | Daily Target 2 | 191.15 | | Daily Target 3 | 192.53666666667 | | Daily Target 4 | 193.61 | | Daily Target 5 | 195 |
Daily price and volume Honeywell International
| Date |
Closing |
Open |
Range |
Volume |
Thu 04 December 2025 |
192.23 (-0.64%) |
193.46 |
191.46 - 193.92 |
1.1049 times |
Wed 03 December 2025 |
193.47 (0.17%) |
193.33 |
192.77 - 195.20 |
1.1531 times |
Tue 02 December 2025 |
193.15 (1.54%) |
190.80 |
189.53 - 193.73 |
1.2347 times |
Mon 01 December 2025 |
190.22 (-1.03%) |
190.28 |
189.98 - 192.16 |
0.8882 times |
Fri 28 November 2025 |
192.19 (1.14%) |
190.00 |
189.60 - 192.40 |
0.4534 times |
Wed 26 November 2025 |
190.02 (-0.52%) |
191.00 |
189.95 - 192.29 |
0.3799 times |
Tue 25 November 2025 |
191.02 (1.25%) |
189.82 |
189.23 - 191.63 |
1.0104 times |
Mon 24 November 2025 |
188.66 (-0.72%) |
190.05 |
187.04 - 190.19 |
1.4629 times |
Fri 21 November 2025 |
190.02 (1%) |
188.27 |
187.84 - 191.08 |
1.2995 times |
Thu 20 November 2025 |
188.14 (-1.28%) |
192.43 |
186.76 - 193.25 |
1.013 times |
Wed 19 November 2025 |
190.57 (-0.46%) |
190.68 |
189.01 - 191.35 |
0.9361 times |
Weekly price and charts HoneywellInternational Strong weekly Stock price targets for HoneywellInternational HON are 190.88 and 196.55 | Weekly Target 1 | 186.65 | | Weekly Target 2 | 189.44 | | Weekly Target 3 | 192.32 | | Weekly Target 4 | 195.11 | | Weekly Target 5 | 197.99 |
Weekly price and volumes for Honeywell International
| Date |
Closing |
Open |
Range |
Volume |
Thu 04 December 2025 |
192.23 (0.02%) |
190.28 |
189.53 - 195.20 |
0.987 times |
Fri 28 November 2025 |
192.19 (1.14%) |
190.05 |
187.04 - 192.40 |
0.7449 times |
Fri 21 November 2025 |
190.02 (-4.53%) |
197.89 |
186.76 - 199.35 |
1.2855 times |
Fri 14 November 2025 |
199.04 (2.56%) |
194.99 |
193.62 - 203.04 |
1.1017 times |
Fri 07 November 2025 |
194.07 (-3.61%) |
197.66 |
193.70 - 199.73 |
0.7318 times |
Fri 31 October 2025 |
201.33 (0%) |
198.80 |
198.65 - 201.87 |
0.2528 times |
Fri 31 October 2025 |
201.33 (-6.83%) |
218.96 |
198.65 - 219.21 |
1.5161 times |
Fri 24 October 2025 |
216.09 (6.14%) |
204.34 |
204.32 - 222.48 |
1.1031 times |
Fri 17 October 2025 |
203.59 (1.33%) |
202.41 |
200.61 - 209.41 |
1.0508 times |
Fri 10 October 2025 |
200.91 (-4.12%) |
209.52 |
200.72 - 210.69 |
1.2264 times |
Fri 03 October 2025 |
209.55 (0.65%) |
209.89 |
204.37 - 213.02 |
1.2463 times |
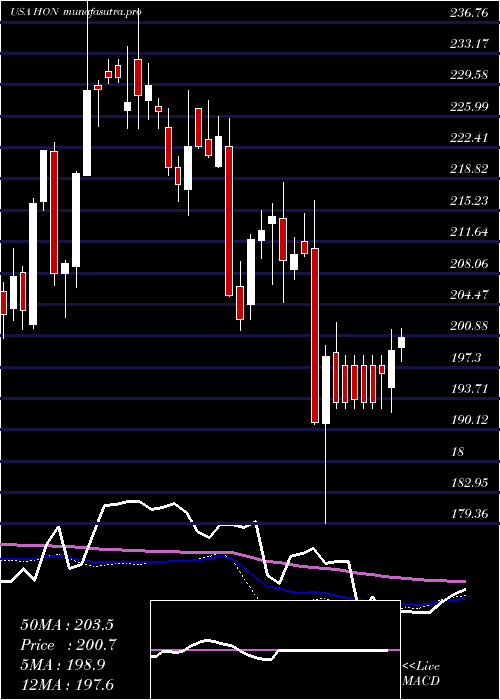
Monthly price and charts HoneywellInternational Strong monthly Stock price targets for HoneywellInternational HON are 190.88 and 196.55 | Monthly Target 1 | 186.65 | | Monthly Target 2 | 189.44 | | Monthly Target 3 | 192.32 | | Monthly Target 4 | 195.11 | | Monthly Target 5 | 197.99 |
Monthly price and volumes Honeywell International
| Date |
Closing |
Open |
Range |
Volume |
Thu 04 December 2025 |
192.23 (0.02%) |
190.28 |
189.53 - 195.20 |
0.2134 times |
Fri 28 November 2025 |
192.19 (-4.54%) |
197.66 |
186.76 - 203.04 |
0.8353 times |
Fri 31 October 2025 |
201.33 (-4.36%) |
210.50 |
198.65 - 222.48 |
1.2506 times |
Tue 30 September 2025 |
210.50 (-4.1%) |
217.03 |
204.37 - 218.12 |
1.326 times |
Fri 29 August 2025 |
219.50 (-1.28%) |
221.37 |
214.20 - 223.08 |
0.844 times |
Thu 31 July 2025 |
222.35 (-4.52%) |
233.58 |
221.22 - 241.72 |
1.0766 times |
Mon 30 June 2025 |
232.88 (2.74%) |
225.00 |
220.20 - 233.56 |
0.7775 times |
Fri 30 May 2025 |
226.67 (7.68%) |
210.40 |
209.49 - 227.89 |
1.1376 times |
Wed 30 April 2025 |
210.50 (-0.59%) |
211.11 |
179.36 - 216.41 |
1.4232 times |
Mon 31 March 2025 |
211.75 (-0.54%) |
213.72 |
204.73 - 218.47 |
1.1158 times |
Fri 28 February 2025 |
212.89 (-4.84%) |
222.50 |
201.54 - 225.70 |
1.2386 times |

DMA SMA EMA moving averages of Honeywell International HON
DMA (daily moving average) of Honeywell International HON
| DMA period | DMA value | | 5 day DMA | 192.25 | | 12 day DMA | 190.93 | | 20 day DMA | 193.71 | | 35 day DMA | 199.37 | | 50 day DMA | 201.83 | | 100 day DMA | 210.58 | | 150 day DMA | 215.61 | | 200 day DMA | 212.83 | EMA (exponential moving average) of Honeywell International HON
| EMA period | EMA current | EMA prev | EMA prev2 | | 5 day EMA | 192.21 | 192.2 | 191.56 | | 12 day EMA | 192.64 | 192.71 | 192.57 | | 20 day EMA | 194.4 | 194.63 | 194.75 | | 35 day EMA | 197.62 | 197.94 | 198.2 | | 50 day EMA | 201.5 | 201.88 | 202.22 |
SMA (simple moving average) of Honeywell International HON
| SMA period | SMA current | SMA prev | SMA prev2 | | 5 day SMA | 192.25 | 191.81 | 191.32 | | 12 day SMA | 190.93 | 191.25 | 191.71 | | 20 day SMA | 193.71 | 193.95 | 194.1 | | 35 day SMA | 199.37 | 199.66 | 200.1 | | 50 day SMA | 201.83 | 202.16 | 202.47 | | 100 day SMA | 210.58 | 211.01 | 211.45 | | 150 day SMA | 215.61 | 215.73 | 215.85 | | 200 day SMA | 212.83 | 212.92 | 213 |
|
|
