HologicInc HOLX full analysis,charts,indicators,moving averages,SMA,DMA,EMA,ADX,MACD,RSIHologic Inc HOLX WideScreen charts, DMA,SMA,EMA technical analysis, forecast prediction, by indicators ADX,MACD,RSI,CCI USA stock exchange
operates under Health Care sector & deals in Medical Electronics
Daily price and charts and targets HologicInc Strong Daily Stock price targets for HologicInc HOLX are 74.42 and 74.99 | Daily Target 1 | 74.27 | | Daily Target 2 | 74.57 | | Daily Target 3 | 74.843333333333 | | Daily Target 4 | 75.14 | | Daily Target 5 | 75.41 |
Daily price and volume Hologic Inc
| Date |
Closing |
Open |
Range |
Volume |
Thu 04 December 2025 |
74.86 (-0.2%) |
75.00 |
74.55 - 75.12 |
1.2883 times |
Wed 03 December 2025 |
75.01 (0.25%) |
74.85 |
74.85 - 75.10 |
0.4483 times |
Tue 02 December 2025 |
74.82 (-0.03%) |
74.96 |
74.80 - 74.98 |
0.7044 times |
Mon 01 December 2025 |
74.84 (-0.17%) |
74.82 |
74.76 - 75.06 |
0.7107 times |
Fri 28 November 2025 |
74.97 (0.23%) |
74.75 |
74.75 - 75.03 |
0.3655 times |
Wed 26 November 2025 |
74.80 (-0.11%) |
74.70 |
74.69 - 74.92 |
0.8973 times |
Tue 25 November 2025 |
74.88 (0.16%) |
74.70 |
74.63 - 74.98 |
1.2678 times |
Mon 24 November 2025 |
74.76 (0.54%) |
74.27 |
74.20 - 74.86 |
1.759 times |
Fri 21 November 2025 |
74.36 (0.32%) |
74.14 |
74.12 - 74.41 |
1.3456 times |
Thu 20 November 2025 |
74.12 (-0.07%) |
74.22 |
74.10 - 74.25 |
1.213 times |
Wed 19 November 2025 |
74.17 (0.08%) |
74.15 |
74.10 - 74.23 |
1.0719 times |
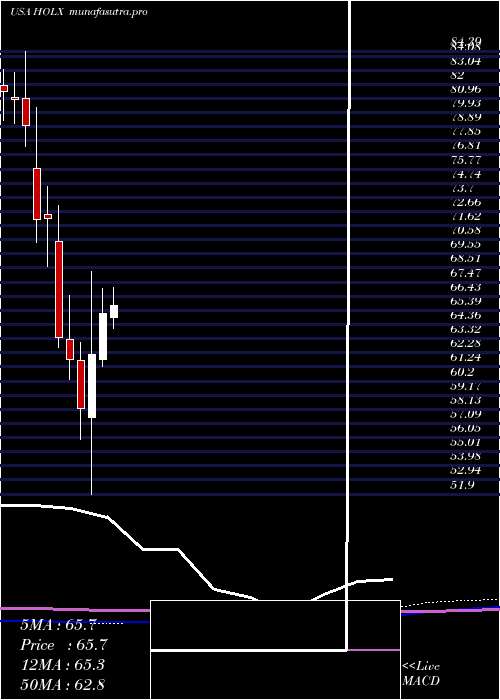
Weekly price and charts HologicInc Strong weekly Stock price targets for HologicInc HOLX are 74.71 and 75.28 | Weekly Target 1 | 74.27 | | Weekly Target 2 | 74.57 | | Weekly Target 3 | 74.843333333333 | | Weekly Target 4 | 75.14 | | Weekly Target 5 | 75.41 |
Weekly price and volumes for Hologic Inc
| Date |
Closing |
Open |
Range |
Volume |
Thu 04 December 2025 |
74.86 (-0.15%) |
74.82 |
74.55 - 75.12 |
0.5688 times |
Fri 28 November 2025 |
74.97 (0.82%) |
74.27 |
74.20 - 75.03 |
0.7742 times |
Fri 21 November 2025 |
74.36 (0.28%) |
74.17 |
74.10 - 74.41 |
1.1574 times |
Fri 14 November 2025 |
74.15 (0.07%) |
74.12 |
74.08 - 74.66 |
0.9034 times |
Fri 07 November 2025 |
74.10 (0.26%) |
74.10 |
73.96 - 74.28 |
1.0862 times |
Fri 31 October 2025 |
73.91 (0%) |
73.94 |
73.86 - 74.00 |
0.1809 times |
Fri 31 October 2025 |
73.91 (-0.11%) |
74.05 |
73.85 - 74.18 |
1.2501 times |
Fri 24 October 2025 |
73.99 (0.53%) |
73.65 |
71.49 - 74.71 |
3.0735 times |
Fri 17 October 2025 |
73.60 (8.62%) |
67.14 |
65.00 - 75.00 |
0.6139 times |
Fri 10 October 2025 |
67.76 (-0.67%) |
68.22 |
66.94 - 68.98 |
0.3916 times |
Fri 03 October 2025 |
68.22 (1.5%) |
67.51 |
66.32 - 69.13 |
0.4973 times |
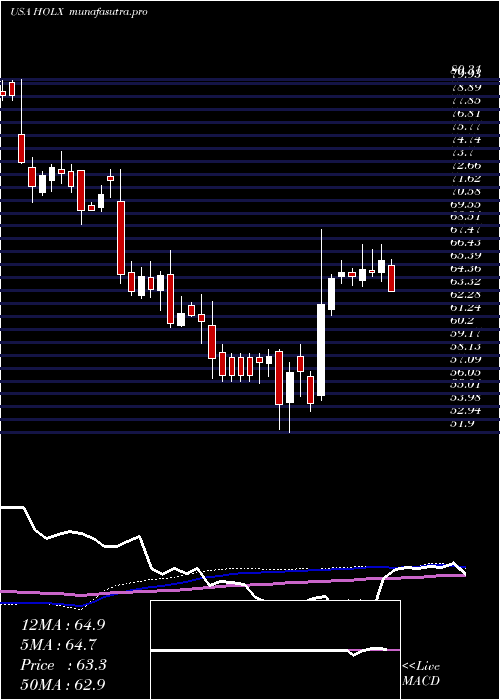
Monthly price and charts HologicInc Strong monthly Stock price targets for HologicInc HOLX are 74.71 and 75.28 | Monthly Target 1 | 74.27 | | Monthly Target 2 | 74.57 | | Monthly Target 3 | 74.843333333333 | | Monthly Target 4 | 75.14 | | Monthly Target 5 | 75.41 |
Monthly price and volumes Hologic Inc
| Date |
Closing |
Open |
Range |
Volume |
Thu 04 December 2025 |
74.86 (-0.15%) |
74.82 |
74.55 - 75.12 |
0.1601 times |
Fri 28 November 2025 |
74.97 (1.43%) |
74.10 |
73.96 - 75.03 |
1.1036 times |
Fri 31 October 2025 |
73.91 (9.51%) |
67.70 |
65.00 - 75.00 |
1.6352 times |
Tue 30 September 2025 |
67.49 (0.55%) |
66.87 |
63.19 - 70.90 |
0.8303 times |
Fri 29 August 2025 |
67.12 (0.45%) |
66.35 |
65.35 - 69.13 |
0.6375 times |
Thu 31 July 2025 |
66.82 (2.55%) |
64.86 |
63.22 - 67.52 |
0.751 times |
Mon 30 June 2025 |
65.16 (4.81%) |
61.76 |
61.28 - 67.00 |
0.9217 times |
Fri 30 May 2025 |
62.17 (6.82%) |
57.54 |
51.90 - 68.25 |
1.8419 times |
Wed 30 April 2025 |
58.20 (-5.78%) |
61.74 |
55.89 - 63.00 |
1.2418 times |
Mon 31 March 2025 |
61.77 (-2.56%) |
63.29 |
60.34 - 66.50 |
0.8769 times |
Fri 28 February 2025 |
63.39 (-12.13%) |
70.45 |
62.70 - 73.07 |
0.8253 times |
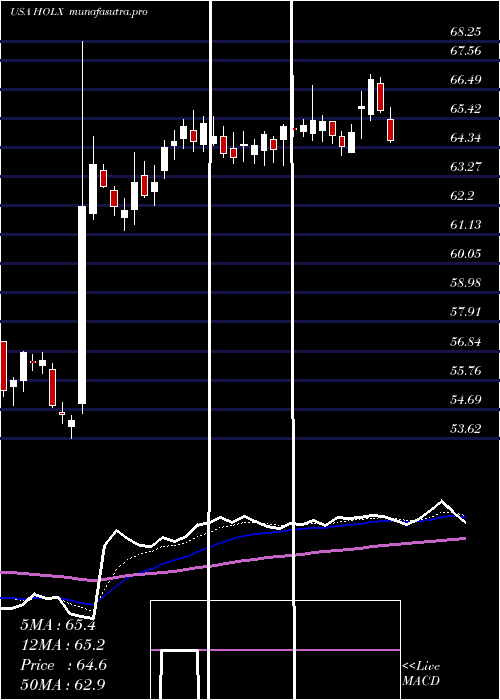
DMA SMA EMA moving averages of Hologic Inc HOLX
DMA (daily moving average) of Hologic Inc HOLX
| DMA period | DMA value | | 5 day DMA | 74.9 | | 12 day DMA | 74.64 | | 20 day DMA | 74.5 | | 35 day DMA | 74.05 | | 50 day DMA | 72.02 | | 100 day DMA | 69.3 | | 150 day DMA | 66.66 | | 200 day DMA | 65.16 | EMA (exponential moving average) of Hologic Inc HOLX
| EMA period | EMA current | EMA prev | EMA prev2 | | 5 day EMA | 74.87 | 74.87 | 74.8 | | 12 day EMA | 74.68 | 74.65 | 74.58 | | 20 day EMA | 74.34 | 74.28 | 74.2 | | 35 day EMA | 73.09 | 72.99 | 72.87 | | 50 day EMA | 71.91 | 71.79 | 71.66 |
SMA (simple moving average) of Hologic Inc HOLX
| SMA period | SMA current | SMA prev | SMA prev2 | | 5 day SMA | 74.9 | 74.89 | 74.86 | | 12 day SMA | 74.64 | 74.58 | 74.51 | | 20 day SMA | 74.5 | 74.47 | 74.42 | | 35 day SMA | 74.05 | 73.83 | 73.57 | | 50 day SMA | 72.02 | 71.85 | 71.7 | | 100 day SMA | 69.3 | 69.18 | 69.08 | | 150 day SMA | 66.66 | 66.55 | 66.43 | | 200 day SMA | 65.16 | 65.11 | 65.05 |
|
|
