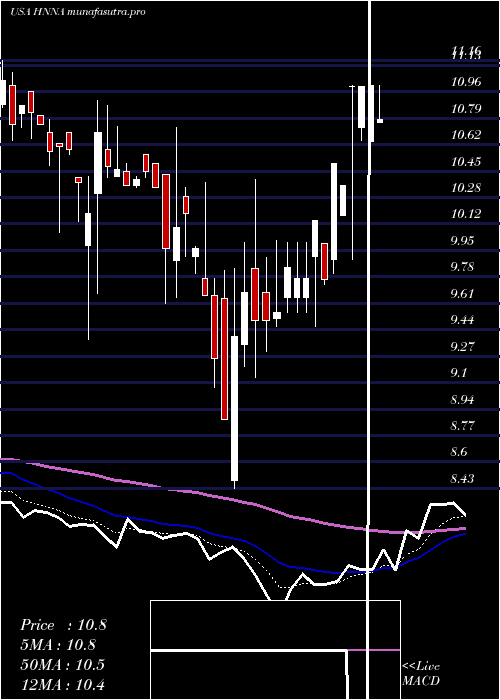
HennessyAdvisors HNNA full analysis,charts,indicators,moving averages,SMA,DMA,EMA,ADX,MACD,RSIHennessy Advisors HNNA WideScreen charts, DMA,SMA,EMA technical analysis, forecast prediction, by indicators ADX,MACD,RSI,CCI USA stock exchange
operates under Finance sector & deals in Investment Managers
Daily price and charts and targets HennessyAdvisors Strong Daily Stock price targets for HennessyAdvisors HNNA are 9.86 and 10.91 | Daily Target 1 | 8.98 | | Daily Target 2 | 9.68 | | Daily Target 3 | 10.03 | | Daily Target 4 | 10.73 | | Daily Target 5 | 11.08 |
Daily price and volume Hennessy Advisors
| Date |
Closing |
Open |
Range |
Volume |
Thu 04 December 2025 |
10.38 (0.48%) |
9.81 |
9.33 - 10.38 |
5.055 times |
Wed 03 December 2025 |
10.33 (1.67%) |
10.34 |
10.17 - 10.34 |
0.2844 times |
Tue 02 December 2025 |
10.16 (0.1%) |
10.31 |
9.84 - 10.31 |
0.3211 times |
Mon 01 December 2025 |
10.15 (0.3%) |
10.02 |
9.87 - 10.30 |
0.4495 times |
Fri 28 November 2025 |
10.12 (-2.5%) |
10.30 |
10.12 - 10.30 |
0.0734 times |
Wed 26 November 2025 |
10.38 (2.77%) |
10.10 |
9.92 - 10.39 |
1.6606 times |
Tue 25 November 2025 |
10.10 (1.3%) |
10.10 |
9.99 - 10.10 |
0.2661 times |
Mon 24 November 2025 |
9.97 (-0.99%) |
10.01 |
9.92 - 10.04 |
0.4312 times |
Fri 21 November 2025 |
10.07 (-0.59%) |
9.86 |
9.84 - 10.08 |
1.211 times |
Thu 20 November 2025 |
10.13 (0.8%) |
10.09 |
9.94 - 10.15 |
0.2477 times |
Wed 19 November 2025 |
10.05 (0.1%) |
9.96 |
9.92 - 10.09 |
0.367 times |
Weekly price and charts HennessyAdvisors Strong weekly Stock price targets for HennessyAdvisors HNNA are 9.86 and 10.91 | Weekly Target 1 | 8.98 | | Weekly Target 2 | 9.68 | | Weekly Target 3 | 10.03 | | Weekly Target 4 | 10.73 | | Weekly Target 5 | 11.08 |
Weekly price and volumes for Hennessy Advisors
| Date |
Closing |
Open |
Range |
Volume |
Thu 04 December 2025 |
10.38 (2.57%) |
10.02 |
9.33 - 10.38 |
1.3317 times |
Fri 28 November 2025 |
10.12 (0.5%) |
10.01 |
9.92 - 10.39 |
0.5299 times |
Fri 21 November 2025 |
10.07 (-0.1%) |
9.86 |
9.82 - 10.18 |
0.8858 times |
Fri 14 November 2025 |
10.08 (1.31%) |
9.83 |
9.83 - 10.21 |
0.5599 times |
Fri 07 November 2025 |
9.95 (1.43%) |
9.42 |
9.34 - 9.96 |
0.5679 times |
Fri 31 October 2025 |
9.81 (0%) |
9.63 |
9.59 - 9.81 |
0.112 times |
Fri 31 October 2025 |
9.81 (2.83%) |
9.35 |
9.13 - 9.89 |
1.0318 times |
Fri 24 October 2025 |
9.54 (-5.26%) |
10.01 |
8.90 - 10.01 |
2.7295 times |
Fri 17 October 2025 |
10.07 (-3.91%) |
10.46 |
9.62 - 11.02 |
1.0498 times |
Fri 10 October 2025 |
10.48 (-2.06%) |
10.60 |
10.35 - 10.82 |
1.2018 times |
Fri 03 October 2025 |
10.70 (-0.74%) |
10.73 |
9.83 - 10.88 |
1.0358 times |

Monthly price and charts HennessyAdvisors Strong monthly Stock price targets for HennessyAdvisors HNNA are 9.86 and 10.91 | Monthly Target 1 | 8.98 | | Monthly Target 2 | 9.68 | | Monthly Target 3 | 10.03 | | Monthly Target 4 | 10.73 | | Monthly Target 5 | 11.08 |
Monthly price and volumes Hennessy Advisors
| Date |
Closing |
Open |
Range |
Volume |
Thu 04 December 2025 |
10.38 (2.57%) |
10.02 |
9.33 - 10.38 |
0.309 times |
Fri 28 November 2025 |
10.12 (3.16%) |
9.42 |
9.34 - 10.39 |
0.5902 times |
Fri 31 October 2025 |
9.81 (-6.12%) |
10.48 |
8.90 - 11.02 |
1.4967 times |
Tue 30 September 2025 |
10.45 (-10.53%) |
11.55 |
10.12 - 13.00 |
1.191 times |
Fri 29 August 2025 |
11.68 (-8.18%) |
12.67 |
10.42 - 12.86 |
1.1307 times |
Thu 31 July 2025 |
12.72 (0.95%) |
12.59 |
11.60 - 13.19 |
0.6618 times |
Mon 30 June 2025 |
12.60 (16.67%) |
10.91 |
10.55 - 12.60 |
0.772 times |
Fri 30 May 2025 |
10.80 (0.19%) |
10.54 |
10.06 - 11.25 |
0.9168 times |
Wed 30 April 2025 |
10.78 (8.23%) |
9.88 |
8.43 - 11.00 |
1.7157 times |
Mon 31 March 2025 |
9.96 (-10.51%) |
10.88 |
9.38 - 11.16 |
1.2162 times |
Fri 28 February 2025 |
11.13 (-9.51%) |
12.47 |
10.80 - 13.12 |
0.8639 times |

DMA SMA EMA moving averages of Hennessy Advisors HNNA
DMA (daily moving average) of Hennessy Advisors HNNA
| DMA period | DMA value | | 5 day DMA | 10.23 | | 12 day DMA | 10.16 | | 20 day DMA | 10.09 | | 35 day DMA | 9.9 | | 50 day DMA | 10.06 | | 100 day DMA | 10.91 | | 150 day DMA | 11.04 | | 200 day DMA | 10.92 | EMA (exponential moving average) of Hennessy Advisors HNNA
| EMA period | EMA current | EMA prev | EMA prev2 | | 5 day EMA | 10.27 | 10.21 | 10.15 | | 12 day EMA | 10.18 | 10.14 | 10.11 | | 20 day EMA | 10.12 | 10.09 | 10.07 | | 35 day EMA | 10.13 | 10.11 | 10.1 | | 50 day EMA | 10.14 | 10.13 | 10.12 |
SMA (simple moving average) of Hennessy Advisors HNNA
| SMA period | SMA current | SMA prev | SMA prev2 | | 5 day SMA | 10.23 | 10.23 | 10.18 | | 12 day SMA | 10.16 | 10.13 | 10.1 | | 20 day SMA | 10.09 | 10.06 | 10.03 | | 35 day SMA | 9.9 | 9.89 | 9.87 | | 50 day SMA | 10.06 | 10.06 | 10.06 | | 100 day SMA | 10.91 | 10.92 | 10.94 | | 150 day SMA | 11.04 | 11.04 | 11.05 | | 200 day SMA | 10.92 | 10.92 | 10.93 |
|
|
