StrategyShares HNDL full analysis,charts,indicators,moving averages,SMA,DMA,EMA,ADX,MACD,RSIStrategy Shares HNDL WideScreen charts, DMA,SMA,EMA technical analysis, forecast prediction, by indicators ADX,MACD,RSI,CCI USA stock exchange
operates under N A sector & deals in N A
Daily price and charts and targets StrategyShares Strong Daily Stock price targets for StrategyShares HNDL are 22.2 and 22.3 | Daily Target 1 | 22.18 | | Daily Target 2 | 22.22 | | Daily Target 3 | 22.283333333333 | | Daily Target 4 | 22.32 | | Daily Target 5 | 22.38 |
Daily price and volume Strategy Shares
| Date |
Closing |
Open |
Range |
Volume |
Fri 05 December 2025 |
22.25 (-0.09%) |
22.31 |
22.25 - 22.35 |
1.4525 times |
Thu 04 December 2025 |
22.27 (-0.04%) |
22.23 |
22.23 - 22.32 |
1.0873 times |
Wed 03 December 2025 |
22.28 (0.27%) |
22.01 |
22.01 - 22.32 |
0.8728 times |
Tue 02 December 2025 |
22.22 (0%) |
22.23 |
22.19 - 22.28 |
0.5462 times |
Mon 01 December 2025 |
22.22 (-0.71%) |
22.20 |
22.20 - 22.31 |
0.9616 times |
Fri 28 November 2025 |
22.38 (0.27%) |
22.29 |
22.29 - 22.41 |
1.2196 times |
Wed 26 November 2025 |
22.32 (0.63%) |
22.16 |
22.16 - 22.34 |
1.7708 times |
Tue 25 November 2025 |
22.18 (0.73%) |
22.02 |
22.02 - 22.20 |
0.3769 times |
Mon 24 November 2025 |
22.02 (0.41%) |
21.95 |
21.91 - 22.08 |
0.9114 times |
Fri 21 November 2025 |
21.93 (0.6%) |
21.83 |
21.76 - 21.97 |
0.8008 times |
Thu 20 November 2025 |
21.80 (-0.32%) |
22.11 |
21.72 - 22.14 |
1.161 times |
Weekly price and charts StrategyShares Strong weekly Stock price targets for StrategyShares HNDL are 22.13 and 22.47 | Weekly Target 1 | 21.86 | | Weekly Target 2 | 22.06 | | Weekly Target 3 | 22.203333333333 | | Weekly Target 4 | 22.4 | | Weekly Target 5 | 22.54 |
Weekly price and volumes for Strategy Shares
| Date |
Closing |
Open |
Range |
Volume |
Fri 05 December 2025 |
22.25 (-0.58%) |
22.20 |
22.01 - 22.35 |
0.8908 times |
Fri 28 November 2025 |
22.38 (2.05%) |
21.95 |
21.91 - 22.41 |
0.7746 times |
Fri 21 November 2025 |
21.93 (-0.72%) |
21.97 |
21.72 - 22.14 |
0.9685 times |
Fri 14 November 2025 |
22.09 (-0.36%) |
22.49 |
21.96 - 22.49 |
1.1856 times |
Fri 07 November 2025 |
22.17 (-0.36%) |
22.09 |
22.00 - 22.25 |
0.9588 times |
Fri 31 October 2025 |
22.25 (0%) |
22.31 |
22.21 - 22.36 |
0.3506 times |
Fri 31 October 2025 |
22.25 (-0.76%) |
22.45 |
22.21 - 22.57 |
1.2463 times |
Fri 24 October 2025 |
22.42 (0.81%) |
22.24 |
22.24 - 22.46 |
0.7658 times |
Fri 17 October 2025 |
22.24 (0.72%) |
22.16 |
22.02 - 22.45 |
1.2175 times |
Fri 10 October 2025 |
22.08 (-1.6%) |
22.49 |
22.08 - 22.50 |
1.6415 times |
Fri 03 October 2025 |
22.44 (1.04%) |
22.22 |
22.21 - 22.50 |
1.5775 times |
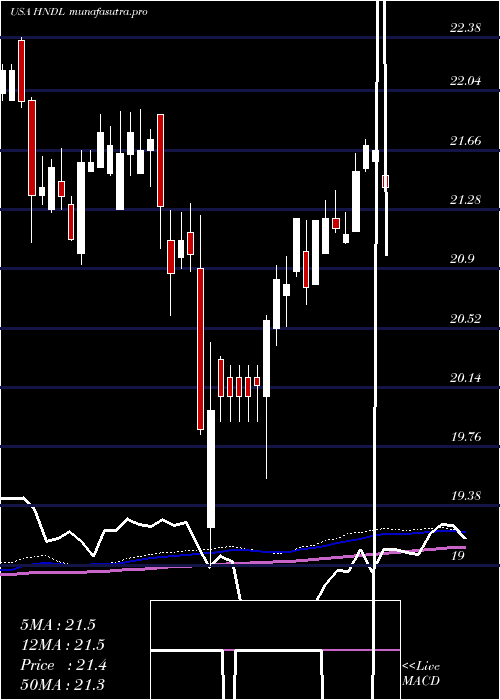
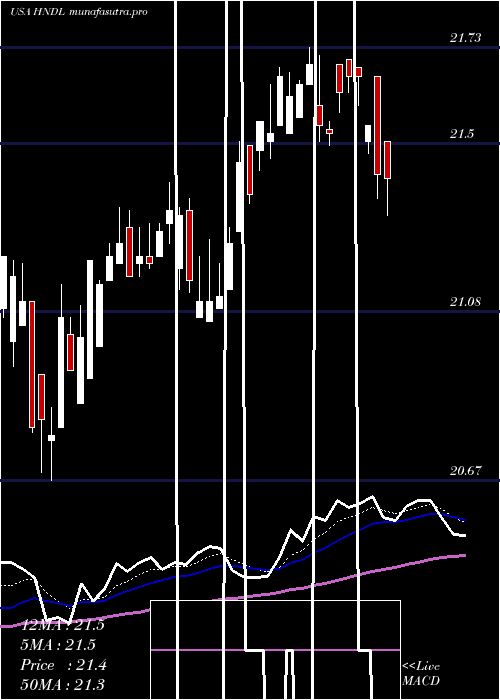
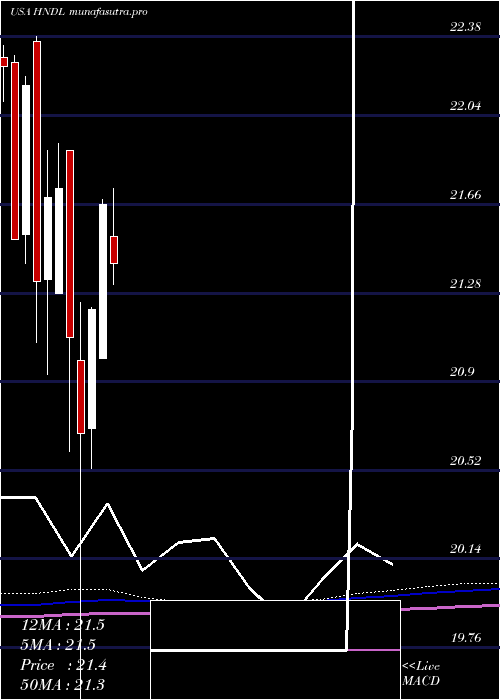
Monthly price and charts StrategyShares Strong monthly Stock price targets for StrategyShares HNDL are 22.13 and 22.47 | Monthly Target 1 | 21.86 | | Monthly Target 2 | 22.06 | | Monthly Target 3 | 22.203333333333 | | Monthly Target 4 | 22.4 | | Monthly Target 5 | 22.54 |
Monthly price and volumes Strategy Shares
| Date |
Closing |
Open |
Range |
Volume |
Fri 05 December 2025 |
22.25 (-0.58%) |
22.20 |
22.01 - 22.35 |
0.1932 times |
Fri 28 November 2025 |
22.38 (0.58%) |
22.09 |
21.72 - 22.49 |
0.8432 times |
Fri 31 October 2025 |
22.25 (-0.13%) |
22.30 |
22.02 - 22.57 |
1.398 times |
Tue 30 September 2025 |
22.28 (1.97%) |
21.67 |
21.50 - 22.32 |
1.1259 times |
Fri 29 August 2025 |
21.85 (0.88%) |
21.67 |
21.55 - 21.95 |
0.9776 times |
Thu 31 July 2025 |
21.66 (0%) |
21.52 |
21.32 - 21.84 |
1.0635 times |
Mon 30 June 2025 |
21.66 (2.12%) |
21.00 |
21.00 - 21.68 |
1.2087 times |
Fri 30 May 2025 |
21.21 (2.56%) |
20.70 |
20.53 - 21.22 |
0.9542 times |
Wed 30 April 2025 |
20.68 (-1.94%) |
20.99 |
19.00 - 21.24 |
1.1708 times |
Mon 31 March 2025 |
21.09 (-2.95%) |
21.89 |
20.60 - 21.89 |
1.0649 times |
Fri 28 February 2025 |
21.73 (0.18%) |
21.28 |
21.28 - 21.92 |
1.1923 times |
DMA SMA EMA moving averages of Strategy Shares HNDL
DMA (daily moving average) of Strategy Shares HNDL
| DMA period | DMA value | | 5 day DMA | 22.25 | | 12 day DMA | 22.15 | | 20 day DMA | 22.15 | | 35 day DMA | 22.22 | | 50 day DMA | 22.25 | | 100 day DMA | 22.06 | | 150 day DMA | 21.78 | | 200 day DMA | 21.52 | EMA (exponential moving average) of Strategy Shares HNDL
| EMA period | EMA current | EMA prev | EMA prev2 | | 5 day EMA | 22.24 | 22.24 | 22.23 | | 12 day EMA | 22.2 | 22.19 | 22.17 | | 20 day EMA | 22.2 | 22.19 | 22.18 | | 35 day EMA | 22.2 | 22.2 | 22.2 | | 50 day EMA | 22.24 | 22.24 | 22.24 |
SMA (simple moving average) of Strategy Shares HNDL
| SMA period | SMA current | SMA prev | SMA prev2 | | 5 day SMA | 22.25 | 22.27 | 22.28 | | 12 day SMA | 22.15 | 22.12 | 22.09 | | 20 day SMA | 22.15 | 22.14 | 22.14 | | 35 day SMA | 22.22 | 22.22 | 22.22 | | 50 day SMA | 22.25 | 22.24 | 22.24 | | 100 day SMA | 22.06 | 22.05 | 22.04 | | 150 day SMA | 21.78 | 21.77 | 21.76 | | 200 day SMA | 21.52 | 21.52 | 21.52 |
|
|
