HomestreetInc HMST full analysis,charts,indicators,moving averages,SMA,DMA,EMA,ADX,MACD,RSIHomestreet Inc HMST WideScreen charts, DMA,SMA,EMA technical analysis, forecast prediction, by indicators ADX,MACD,RSI,CCI USA stock exchange
operates under Finance sector & deals in Major Banks
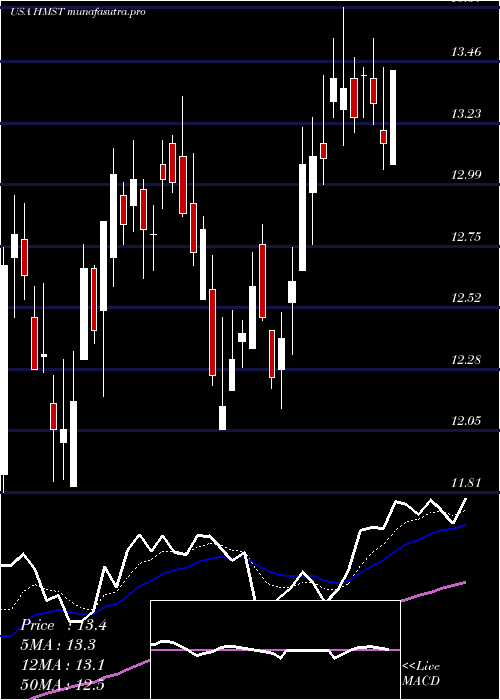
Daily price and charts and targets HomestreetInc Strong Daily Stock price targets for HomestreetInc HMST are 13.04 and 13.26 | Daily Target 1 | 12.99 | | Daily Target 2 | 13.09 | | Daily Target 3 | 13.213333333333 | | Daily Target 4 | 13.31 | | Daily Target 5 | 13.43 |
Daily price and volume Homestreet Inc
| Date |
Closing |
Open |
Range |
Volume |
Mon 28 July 2025 |
13.18 (-0.53%) |
13.22 |
13.12 - 13.34 |
0.7042 times |
Fri 25 July 2025 |
13.25 (0.45%) |
13.21 |
13.20 - 13.41 |
0.5236 times |
Thu 24 July 2025 |
13.19 (-3.01%) |
13.51 |
13.19 - 13.59 |
0.5662 times |
Wed 23 July 2025 |
13.60 (2.95%) |
13.25 |
13.25 - 13.68 |
0.6758 times |
Tue 22 July 2025 |
13.21 (-0.08%) |
13.17 |
13.17 - 13.46 |
1.0554 times |
Mon 21 July 2025 |
13.22 (-0.97%) |
13.37 |
13.20 - 13.47 |
1.1102 times |
Fri 18 July 2025 |
13.35 (2.14%) |
13.16 |
12.96 - 13.46 |
1.5592 times |
Thu 17 July 2025 |
13.07 (-0.68%) |
13.20 |
12.85 - 13.30 |
1.7332 times |
Wed 16 July 2025 |
13.16 (0.61%) |
13.22 |
13.05 - 13.25 |
1.1426 times |
Tue 15 July 2025 |
13.08 (-2.61%) |
13.43 |
13.05 - 13.43 |
0.9295 times |
Mon 14 July 2025 |
13.43 (2.13%) |
13.07 |
13.07 - 13.43 |
0.5622 times |
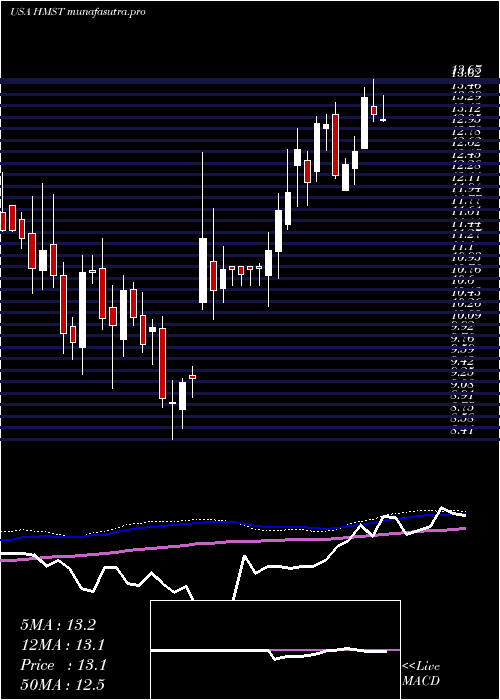
Weekly price and charts HomestreetInc Strong weekly Stock price targets for HomestreetInc HMST are 13.04 and 13.26 | Weekly Target 1 | 12.99 | | Weekly Target 2 | 13.09 | | Weekly Target 3 | 13.213333333333 | | Weekly Target 4 | 13.31 | | Weekly Target 5 | 13.43 |
Weekly price and volumes for Homestreet Inc
| Date |
Closing |
Open |
Range |
Volume |
Mon 28 July 2025 |
13.18 (-0.53%) |
13.22 |
13.12 - 13.34 |
0.1261 times |
Fri 25 July 2025 |
13.25 (-0.75%) |
13.37 |
13.17 - 13.68 |
0.7038 times |
Fri 18 July 2025 |
13.35 (1.52%) |
13.07 |
12.85 - 13.46 |
1.061 times |
Fri 11 July 2025 |
13.15 (-1.87%) |
13.28 |
13.05 - 13.67 |
1.2397 times |
Thu 03 July 2025 |
13.40 (6.18%) |
12.66 |
12.66 - 13.55 |
1.1797 times |
Fri 27 June 2025 |
12.62 (1.61%) |
12.36 |
12.13 - 12.84 |
1.2717 times |
Fri 20 June 2025 |
12.42 (1.31%) |
12.05 |
12.05 - 12.51 |
0.9614 times |
Fri 13 June 2025 |
12.26 (-5.76%) |
13.15 |
12.22 - 13.33 |
1.3963 times |
Fri 06 June 2025 |
13.01 (-0.15%) |
12.95 |
12.63 - 13.16 |
1.0079 times |
Fri 30 May 2025 |
13.03 (7.15%) |
12.32 |
12.18 - 13.13 |
1.0526 times |
Fri 23 May 2025 |
12.16 (-3.8%) |
12.48 |
11.83 - 12.61 |
1.0747 times |
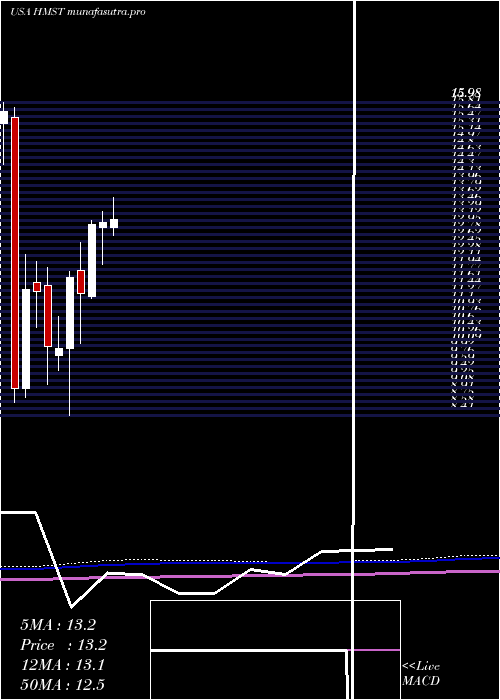
Monthly price and charts HomestreetInc Strong monthly Stock price targets for HomestreetInc HMST are 12.97 and 13.89 | Monthly Target 1 | 12.29 | | Monthly Target 2 | 12.73 | | Monthly Target 3 | 13.206666666667 | | Monthly Target 4 | 13.65 | | Monthly Target 5 | 14.13 |
Monthly price and volumes Homestreet Inc
| Date |
Closing |
Open |
Range |
Volume |
Mon 28 July 2025 |
13.18 (0.84%) |
12.96 |
12.76 - 13.68 |
0.3864 times |
Mon 30 June 2025 |
13.07 (0.31%) |
12.95 |
12.05 - 13.33 |
0.4652 times |
Fri 30 May 2025 |
13.03 (14.7%) |
11.29 |
11.24 - 13.13 |
0.5663 times |
Wed 30 April 2025 |
11.36 (-3.24%) |
11.92 |
10.16 - 12.60 |
1.2562 times |
Mon 31 March 2025 |
11.74 (16.93%) |
10.03 |
8.41 - 11.88 |
1.6255 times |
Fri 28 February 2025 |
10.04 (-0.3%) |
9.87 |
9.50 - 10.80 |
0.6879 times |
Fri 31 January 2025 |
10.07 (-11.82%) |
11.56 |
9.15 - 11.99 |
1.3848 times |
Tue 31 December 2024 |
11.42 (-0.35%) |
11.62 |
10.54 - 12.14 |
1.0314 times |
Tue 26 November 2024 |
11.46 (26.49%) |
9.07 |
8.84 - 12.31 |
1.5305 times |
Thu 31 October 2024 |
9.06 (-42.51%) |
15.61 |
8.72 - 15.84 |
1.0657 times |
Mon 30 September 2024 |
15.76 (-1.5%) |
15.92 |
14.47 - 16.10 |
0.6938 times |
DMA SMA EMA moving averages of Homestreet Inc HMST
DMA (daily moving average) of Homestreet Inc HMST
| DMA period | DMA value | | 5 day DMA | 13.29 | | 12 day DMA | 13.24 | | 20 day DMA | 13.24 | | 35 day DMA | 12.96 | | 50 day DMA | 12.85 | | 100 day DMA | 11.72 | | 150 day DMA | 11.28 | | 200 day DMA | 11.62 | EMA (exponential moving average) of Homestreet Inc HMST
| EMA period | EMA current | EMA prev | EMA prev2 | | 5 day EMA | 13.25 | 13.28 | 13.3 | | 12 day EMA | 13.22 | 13.23 | 13.23 | | 20 day EMA | 13.15 | 13.15 | 13.14 | | 35 day EMA | 13.02 | 13.01 | 13 | | 50 day EMA | 12.82 | 12.81 | 12.79 |
SMA (simple moving average) of Homestreet Inc HMST
| SMA period | SMA current | SMA prev | SMA prev2 | | 5 day SMA | 13.29 | 13.29 | 13.31 | | 12 day SMA | 13.24 | 13.25 | 13.26 | | 20 day SMA | 13.24 | 13.22 | 13.17 | | 35 day SMA | 12.96 | 12.95 | 12.94 | | 50 day SMA | 12.85 | 12.82 | 12.8 | | 100 day SMA | 11.72 | 11.69 | 11.66 | | 150 day SMA | 11.28 | 11.26 | 11.25 | | 200 day SMA | 11.62 | 11.63 | 11.64 |
|
|
