HoulihanLokey HLI full analysis,charts,indicators,moving averages,SMA,DMA,EMA,ADX,MACD,RSIHoulihan Lokey HLI WideScreen charts, DMA,SMA,EMA technical analysis, forecast prediction, by indicators ADX,MACD,RSI,CCI USA stock exchange
operates under Finance sector & deals in Investment Managers
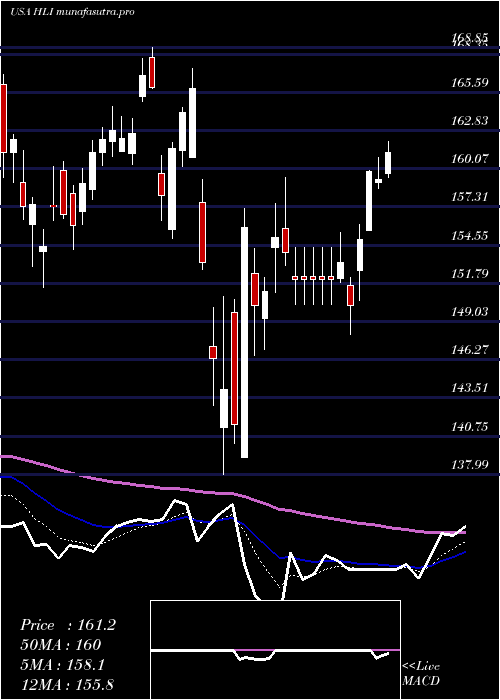
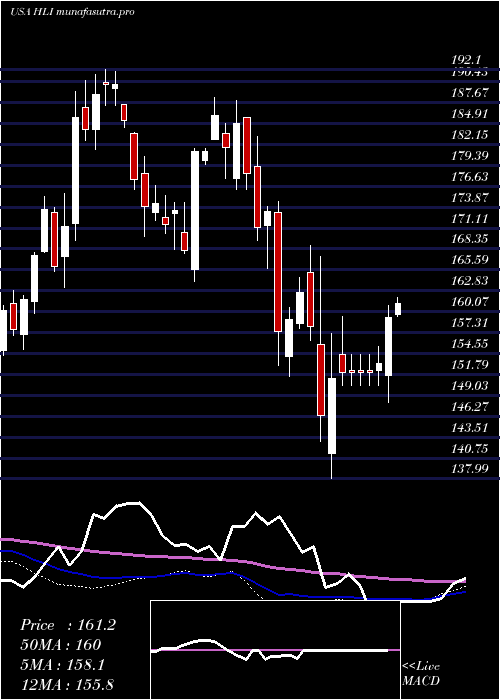
Daily price and charts and targets HoulihanLokey Strong Daily Stock price targets for HoulihanLokey HLI are 191.83 and 195.37 | Daily Target 1 | 189.19 | | Daily Target 2 | 190.92 | | Daily Target 3 | 192.73 | | Daily Target 4 | 194.46 | | Daily Target 5 | 196.27 |
Daily price and volume Houlihan Lokey
| Date |
Closing |
Open |
Range |
Volume |
Mon 20 October 2025 |
192.65 (1.29%) |
191.72 |
191.00 - 194.54 |
1.4036 times |
Fri 17 October 2025 |
190.19 (-1.06%) |
189.92 |
188.00 - 191.44 |
0.8868 times |
Thu 16 October 2025 |
192.23 (-0.29%) |
192.72 |
187.38 - 192.72 |
0.5535 times |
Wed 15 October 2025 |
192.79 (-0.41%) |
195.77 |
192.20 - 196.33 |
1.1243 times |
Tue 14 October 2025 |
193.59 (1.15%) |
190.23 |
190.23 - 195.11 |
0.905 times |
Mon 13 October 2025 |
191.39 (1.77%) |
189.64 |
188.57 - 191.89 |
0.8202 times |
Fri 10 October 2025 |
188.06 (-0.92%) |
191.41 |
186.81 - 191.78 |
1.4023 times |
Thu 09 October 2025 |
189.80 (-0.78%) |
191.00 |
188.94 - 191.62 |
1.0681 times |
Wed 08 October 2025 |
191.30 (-1.55%) |
195.43 |
191.26 - 196.01 |
0.9312 times |
Tue 07 October 2025 |
194.31 (-1.33%) |
197.04 |
193.16 - 198.20 |
0.905 times |
Mon 06 October 2025 |
196.93 (-2.22%) |
202.00 |
195.89 - 203.29 |
0.5449 times |
Weekly price and charts HoulihanLokey Strong weekly Stock price targets for HoulihanLokey HLI are 191.83 and 195.37 | Weekly Target 1 | 189.19 | | Weekly Target 2 | 190.92 | | Weekly Target 3 | 192.73 | | Weekly Target 4 | 194.46 | | Weekly Target 5 | 196.27 |
Weekly price and volumes for Houlihan Lokey
| Date |
Closing |
Open |
Range |
Volume |
Mon 20 October 2025 |
192.65 (1.29%) |
191.72 |
191.00 - 194.54 |
0.3264 times |
Fri 17 October 2025 |
190.19 (1.13%) |
189.64 |
187.38 - 196.33 |
0.9976 times |
Fri 10 October 2025 |
188.06 (-6.63%) |
202.00 |
186.81 - 203.29 |
1.1282 times |
Fri 03 October 2025 |
201.41 (-2.21%) |
206.00 |
199.58 - 208.78 |
1.0528 times |
Fri 26 September 2025 |
205.97 (-1.32%) |
207.07 |
201.19 - 211.78 |
1.1185 times |
Fri 19 September 2025 |
208.73 (1.73%) |
205.74 |
201.09 - 209.39 |
1.337 times |
Fri 12 September 2025 |
205.19 (4.11%) |
197.18 |
195.30 - 208.50 |
1.3088 times |
Fri 05 September 2025 |
197.09 (-1.08%) |
196.22 |
189.67 - 198.51 |
1.1059 times |
Fri 29 August 2025 |
199.25 (0%) |
201.25 |
197.56 - 201.25 |
0.3597 times |
Fri 29 August 2025 |
199.25 (0.79%) |
197.71 |
195.78 - 201.63 |
1.265 times |
Fri 22 August 2025 |
197.69 (3.65%) |
190.26 |
190.02 - 197.76 |
1.1278 times |
Monthly price and charts HoulihanLokey Strong monthly Stock price targets for HoulihanLokey HLI are 180.42 and 199.04 | Monthly Target 1 | 176.34 | | Monthly Target 2 | 184.5 | | Monthly Target 3 | 194.96333333333 | | Monthly Target 4 | 203.12 | | Monthly Target 5 | 213.58 |
Monthly price and volumes Houlihan Lokey
| Date |
Closing |
Open |
Range |
Volume |
Mon 20 October 2025 |
192.65 (-6.17%) |
204.28 |
186.81 - 205.43 |
0.6023 times |
Tue 30 September 2025 |
205.32 (3.05%) |
196.22 |
189.67 - 211.78 |
1.1123 times |
Fri 29 August 2025 |
199.25 (4.51%) |
187.52 |
185.05 - 201.63 |
0.9957 times |
Thu 31 July 2025 |
190.66 (5.95%) |
176.75 |
176.75 - 198.78 |
1.2064 times |
Mon 30 June 2025 |
179.95 (3.02%) |
173.02 |
170.59 - 185.40 |
0.8537 times |
Fri 30 May 2025 |
174.68 (7.77%) |
163.14 |
160.94 - 183.05 |
1.0074 times |
Wed 30 April 2025 |
162.08 (0.36%) |
161.41 |
137.99 - 167.33 |
1.1154 times |
Mon 31 March 2025 |
161.50 (-6.84%) |
173.12 |
151.46 - 174.59 |
1.0501 times |
Fri 28 February 2025 |
173.35 (-4.61%) |
177.67 |
165.71 - 188.00 |
0.8395 times |
Fri 31 January 2025 |
181.72 (4.64%) |
173.87 |
164.05 - 188.36 |
1.2173 times |
Tue 31 December 2024 |
173.66 (-8.62%) |
187.38 |
170.00 - 187.38 |
0.7712 times |

DMA SMA EMA moving averages of Houlihan Lokey HLI
DMA (daily moving average) of Houlihan Lokey HLI
| DMA period | DMA value | | 5 day DMA | 192.29 | | 12 day DMA | 192.89 | | 20 day DMA | 197.71 | | 35 day DMA | 199.48 | | 50 day DMA | 198.37 | | 100 day DMA | 191.44 | | 150 day DMA | 181.8 | | 200 day DMA | 179.78 | EMA (exponential moving average) of Houlihan Lokey HLI
| EMA period | EMA current | EMA prev | EMA prev2 | | 5 day EMA | 192.01 | 191.69 | 192.44 | | 12 day EMA | 193.78 | 193.99 | 194.68 | | 20 day EMA | 195.64 | 195.95 | 196.56 | | 35 day EMA | 196.43 | 196.65 | 197.03 | | 50 day EMA | 197.13 | 197.31 | 197.6 |
SMA (simple moving average) of Houlihan Lokey HLI
| SMA period | SMA current | SMA prev | SMA prev2 | | 5 day SMA | 192.29 | 192.04 | 191.61 | | 12 day SMA | 192.89 | 193.61 | 194.49 | | 20 day SMA | 197.71 | 198.49 | 199.41 | | 35 day SMA | 199.48 | 199.67 | 199.93 | | 50 day SMA | 198.37 | 198.33 | 198.3 | | 100 day SMA | 191.44 | 191.27 | 191.1 | | 150 day SMA | 181.8 | 181.59 | 181.38 | | 200 day SMA | 179.78 | 179.67 | 179.58 |
|
|
