HuntingtonIngalls HII full analysis,charts,indicators,moving averages,SMA,DMA,EMA,ADX,MACD,RSIHuntington Ingalls HII WideScreen charts, DMA,SMA,EMA technical analysis, forecast prediction, by indicators ADX,MACD,RSI,CCI USA stock exchange
operates under Capital Goods sector & deals in Marine Transportation
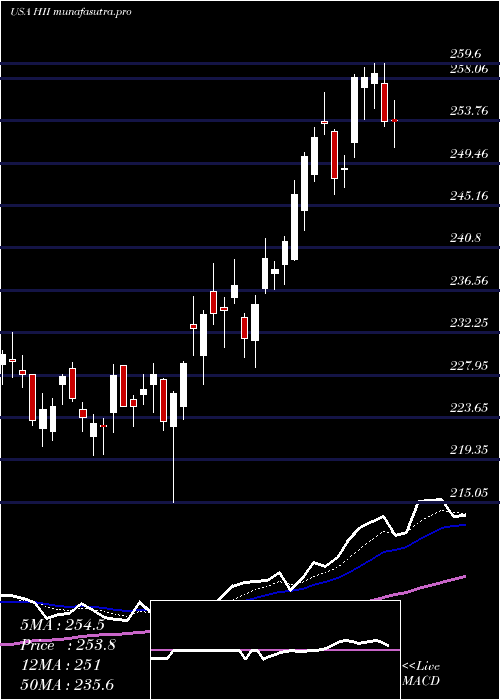
Daily price and charts and targets HuntingtonIngalls Strong Daily Stock price targets for HuntingtonIngalls HII are 283.79 and 289.02 | Daily Target 1 | 279.64 | | Daily Target 2 | 282.71 | | Daily Target 3 | 284.87333333333 | | Daily Target 4 | 287.94 | | Daily Target 5 | 290.1 |
Daily price and volume Huntington Ingalls
| Date |
Closing |
Open |
Range |
Volume |
Mon 20 October 2025 |
285.77 (2.05%) |
281.81 |
281.81 - 287.04 |
0.7936 times |
Fri 17 October 2025 |
280.02 (-0.93%) |
280.16 |
277.01 - 283.40 |
0.8907 times |
Thu 16 October 2025 |
282.66 (-0.81%) |
286.65 |
282.51 - 287.57 |
0.8775 times |
Wed 15 October 2025 |
284.96 (-2.39%) |
293.00 |
278.64 - 295.49 |
1.3939 times |
Tue 14 October 2025 |
291.94 (1.4%) |
288.21 |
284.02 - 296.03 |
1.5923 times |
Mon 13 October 2025 |
287.90 (1.74%) |
283.51 |
283.16 - 288.23 |
0.8282 times |
Fri 10 October 2025 |
282.99 (-1.1%) |
286.13 |
281.30 - 287.22 |
1.0447 times |
Thu 09 October 2025 |
286.14 (-1.61%) |
290.83 |
284.71 - 291.49 |
0.8263 times |
Wed 08 October 2025 |
290.83 (1.91%) |
286.74 |
285.36 - 290.83 |
0.6561 times |
Tue 07 October 2025 |
285.38 (-1.08%) |
289.57 |
284.18 - 291.34 |
1.0967 times |
Mon 06 October 2025 |
288.49 (1.5%) |
285.48 |
285.48 - 290.82 |
0.4291 times |
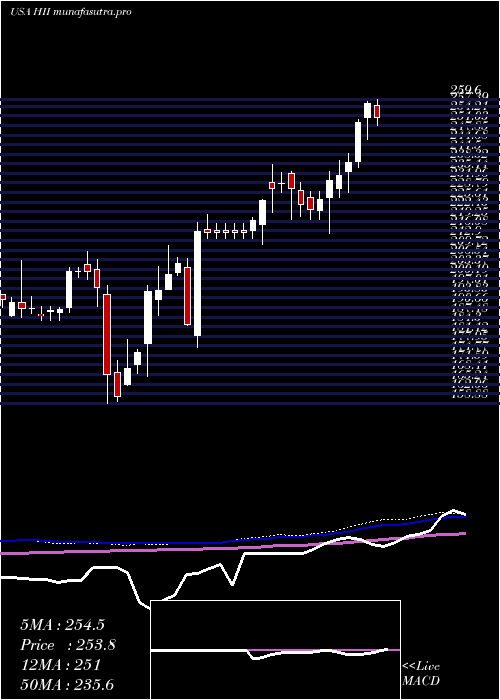
Weekly price and charts HuntingtonIngalls Strong weekly Stock price targets for HuntingtonIngalls HII are 283.79 and 289.02 | Weekly Target 1 | 279.64 | | Weekly Target 2 | 282.71 | | Weekly Target 3 | 284.87333333333 | | Weekly Target 4 | 287.94 | | Weekly Target 5 | 290.1 |
Weekly price and volumes for Huntington Ingalls
| Date |
Closing |
Open |
Range |
Volume |
Mon 20 October 2025 |
285.77 (2.05%) |
281.81 |
281.81 - 287.04 |
0.182 times |
Fri 17 October 2025 |
280.02 (-1.05%) |
283.51 |
277.01 - 296.03 |
1.2804 times |
Fri 10 October 2025 |
282.99 (-0.44%) |
285.48 |
281.30 - 291.49 |
0.9296 times |
Fri 03 October 2025 |
284.24 (1.96%) |
281.38 |
278.81 - 291.52 |
1.0099 times |
Fri 26 September 2025 |
278.77 (1.32%) |
273.88 |
270.20 - 281.10 |
1.4734 times |
Fri 19 September 2025 |
275.13 (0.15%) |
273.13 |
270.29 - 277.00 |
1.8555 times |
Fri 12 September 2025 |
274.71 (1.32%) |
270.87 |
264.00 - 277.74 |
0.9953 times |
Fri 05 September 2025 |
271.13 (0.13%) |
269.64 |
266.00 - 272.26 |
0.942 times |
Fri 29 August 2025 |
270.79 (0%) |
274.69 |
270.37 - 276.19 |
0.2067 times |
Fri 29 August 2025 |
270.79 (0.3%) |
270.53 |
269.14 - 277.31 |
1.1251 times |
Fri 22 August 2025 |
269.98 (1.4%) |
266.86 |
262.66 - 271.63 |
1.1316 times |
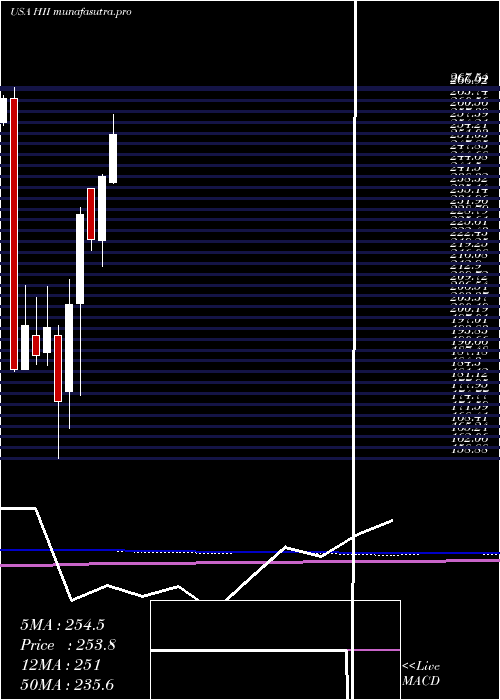
Monthly price and charts HuntingtonIngalls Strong monthly Stock price targets for HuntingtonIngalls HII are 281.39 and 300.41 | Monthly Target 1 | 267.25 | | Monthly Target 2 | 276.51 | | Monthly Target 3 | 286.27 | | Monthly Target 4 | 295.53 | | Monthly Target 5 | 305.29 |
Monthly price and volumes Huntington Ingalls
| Date |
Closing |
Open |
Range |
Volume |
Mon 20 October 2025 |
285.77 (-0.74%) |
284.54 |
277.01 - 296.03 |
0.4493 times |
Tue 30 September 2025 |
287.91 (6.32%) |
269.64 |
264.00 - 288.11 |
0.8555 times |
Fri 29 August 2025 |
270.79 (-2.89%) |
276.87 |
259.00 - 278.86 |
0.7447 times |
Thu 31 July 2025 |
278.86 (15.49%) |
239.68 |
239.55 - 293.14 |
0.9156 times |
Mon 30 June 2025 |
241.46 (8.25%) |
222.90 |
215.05 - 242.04 |
0.8291 times |
Fri 30 May 2025 |
223.06 (-3.16%) |
237.86 |
219.71 - 238.00 |
0.9304 times |
Wed 30 April 2025 |
230.34 (12.89%) |
204.42 |
177.42 - 232.35 |
1.3268 times |
Mon 31 March 2025 |
204.04 (16.21%) |
178.63 |
167.70 - 211.25 |
1.438 times |
Fri 28 February 2025 |
175.58 (-10.99%) |
195.05 |
158.88 - 197.90 |
1.6601 times |
Fri 31 January 2025 |
197.26 (4.39%) |
189.84 |
186.25 - 209.24 |
0.8505 times |
Tue 31 December 2024 |
188.97 (-4.55%) |
194.90 |
186.36 - 206.12 |
0.9032 times |
DMA SMA EMA moving averages of Huntington Ingalls HII
DMA (daily moving average) of Huntington Ingalls HII
| DMA period | DMA value | | 5 day DMA | 285.07 | | 12 day DMA | 285.94 | | 20 day DMA | 283.53 | | 35 day DMA | 278.72 | | 50 day DMA | 275.97 | | 100 day DMA | 261.22 | | 150 day DMA | 246.44 | | 200 day DMA | 231.72 | EMA (exponential moving average) of Huntington Ingalls HII
| EMA period | EMA current | EMA prev | EMA prev2 | | 5 day EMA | 284.42 | 283.75 | 285.61 | | 12 day EMA | 284.44 | 284.2 | 284.96 | | 20 day EMA | 282.95 | 282.65 | 282.93 | | 35 day EMA | 279.86 | 279.51 | 279.48 | | 50 day EMA | 276.13 | 275.74 | 275.57 |
SMA (simple moving average) of Huntington Ingalls HII
| SMA period | SMA current | SMA prev | SMA prev2 | | 5 day SMA | 285.07 | 285.5 | 286.09 | | 12 day SMA | 285.94 | 285.65 | 286.15 | | 20 day SMA | 283.53 | 283.05 | 282.8 | | 35 day SMA | 278.72 | 278.29 | 278.02 | | 50 day SMA | 275.97 | 275.59 | 275.28 | | 100 day SMA | 261.22 | 260.64 | 260.09 | | 150 day SMA | 246.44 | 245.93 | 245.44 | | 200 day SMA | 231.72 | 231.22 | 230.76 |
|
|
