HartfordFinancial HIG full analysis,charts,indicators,moving averages,SMA,DMA,EMA,ADX,MACD,RSIHartford Financial HIG WideScreen charts, DMA,SMA,EMA technical analysis, forecast prediction, by indicators ADX,MACD,RSI,CCI USA stock exchange
operates under Finance sector & deals in Property Casualty Insurers
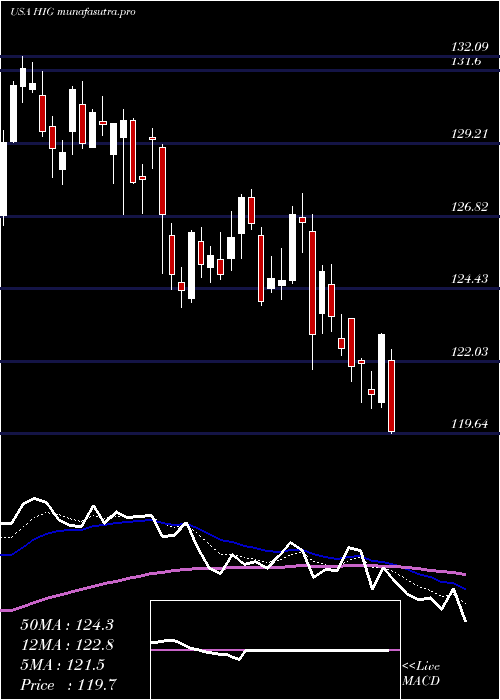
Daily price and charts and targets HartfordFinancial Strong Daily Stock price targets for HartfordFinancial HIG are 130.68 and 132.78 | Daily Target 1 | 130.29 | | Daily Target 2 | 131.07 | | Daily Target 3 | 132.38666666667 | | Daily Target 4 | 133.17 | | Daily Target 5 | 134.49 |
Daily price and volume Hartford Financial
| Date |
Closing |
Open |
Range |
Volume |
Thu 04 December 2025 |
131.86 (-0.89%) |
132.50 |
131.60 - 133.70 |
0.9587 times |
Wed 03 December 2025 |
133.04 (-1.52%) |
135.13 |
132.67 - 135.67 |
1.0803 times |
Tue 02 December 2025 |
135.10 (-0.3%) |
135.22 |
134.29 - 135.68 |
1.1246 times |
Mon 01 December 2025 |
135.50 (-1.12%) |
136.31 |
135.15 - 137.13 |
1.044 times |
Fri 28 November 2025 |
137.03 (-0.26%) |
137.93 |
137.03 - 138.29 |
0.3855 times |
Wed 26 November 2025 |
137.39 (-0.13%) |
137.90 |
137.39 - 138.56 |
0.6462 times |
Tue 25 November 2025 |
137.57 (0.68%) |
137.41 |
137.04 - 138.64 |
0.7863 times |
Mon 24 November 2025 |
136.64 (0.14%) |
137.04 |
135.13 - 137.49 |
1.9392 times |
Fri 21 November 2025 |
136.45 (1.25%) |
135.50 |
134.64 - 137.43 |
0.9197 times |
Thu 20 November 2025 |
134.77 (1.96%) |
133.96 |
133.27 - 135.24 |
1.1156 times |
Wed 19 November 2025 |
132.18 (-0.71%) |
133.16 |
131.40 - 133.48 |
0.8369 times |
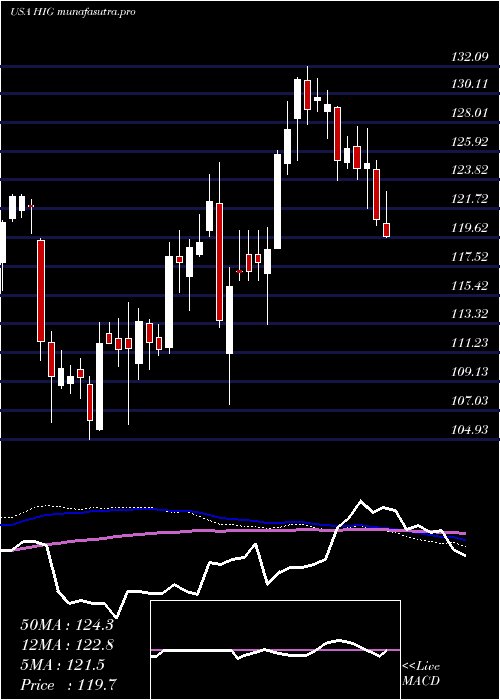
Weekly price and charts HartfordFinancial Strong weekly Stock price targets for HartfordFinancial HIG are 128.97 and 134.5 | Weekly Target 1 | 128 | | Weekly Target 2 | 129.93 | | Weekly Target 3 | 133.53 | | Weekly Target 4 | 135.46 | | Weekly Target 5 | 139.06 |
Weekly price and volumes for Hartford Financial
| Date |
Closing |
Open |
Range |
Volume |
Thu 04 December 2025 |
131.86 (-3.77%) |
136.31 |
131.60 - 137.13 |
1.1463 times |
Fri 28 November 2025 |
137.03 (0.43%) |
137.04 |
135.13 - 138.64 |
1.0236 times |
Fri 21 November 2025 |
136.45 (1.94%) |
134.57 |
131.08 - 137.43 |
1.1819 times |
Fri 14 November 2025 |
133.85 (3.43%) |
128.56 |
128.56 - 135.27 |
0.9766 times |
Fri 07 November 2025 |
129.41 (4.21%) |
124.69 |
124.35 - 129.99 |
0.8885 times |
Fri 31 October 2025 |
124.18 (0%) |
122.33 |
122.33 - 125.00 |
0.2892 times |
Fri 31 October 2025 |
124.18 (-0.74%) |
125.45 |
120.33 - 125.63 |
1.5791 times |
Fri 24 October 2025 |
125.11 (0.52%) |
125.00 |
123.14 - 126.04 |
1.1561 times |
Fri 17 October 2025 |
124.46 (-6.99%) |
128.67 |
123.48 - 131.40 |
1.3644 times |
Tue 07 October 2025 |
133.81 (0.26%) |
133.60 |
132.09 - 134.26 |
0.3941 times |
Fri 03 October 2025 |
133.46 (0.26%) |
133.13 |
131.36 - 134.40 |
0.8329 times |
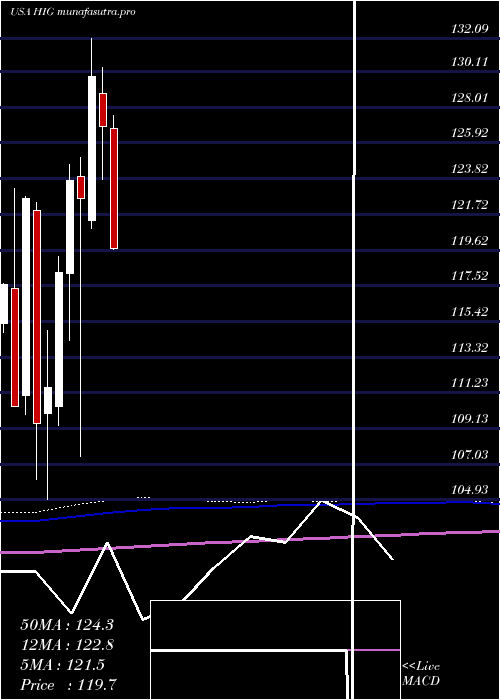
Monthly price and charts HartfordFinancial Strong monthly Stock price targets for HartfordFinancial HIG are 128.97 and 134.5 | Monthly Target 1 | 128 | | Monthly Target 2 | 129.93 | | Monthly Target 3 | 133.53 | | Monthly Target 4 | 135.46 | | Monthly Target 5 | 139.06 |
Monthly price and volumes Hartford Financial
| Date |
Closing |
Open |
Range |
Volume |
Thu 04 December 2025 |
131.86 (-3.77%) |
136.31 |
131.60 - 137.13 |
0.2384 times |
Fri 28 November 2025 |
137.03 (10.35%) |
124.69 |
124.35 - 138.64 |
0.8465 times |
Fri 31 October 2025 |
124.18 (-6.9%) |
132.61 |
120.33 - 134.40 |
1.0995 times |
Tue 30 September 2025 |
133.39 (0.82%) |
131.90 |
129.48 - 135.17 |
1.0869 times |
Fri 29 August 2025 |
132.31 (6.37%) |
124.42 |
122.68 - 134.93 |
0.9484 times |
Thu 31 July 2025 |
124.39 (-1.95%) |
126.76 |
119.61 - 127.55 |
1.2311 times |
Mon 30 June 2025 |
126.87 (-2.29%) |
128.84 |
123.79 - 130.33 |
1.0016 times |
Fri 30 May 2025 |
129.84 (5.84%) |
121.33 |
120.86 - 132.09 |
1.2222 times |
Wed 30 April 2025 |
122.67 (-0.86%) |
123.94 |
107.49 - 125.08 |
1.1668 times |
Mon 31 March 2025 |
123.73 (4.61%) |
118.26 |
114.28 - 124.64 |
1.1586 times |
Fri 28 February 2025 |
118.28 (6.03%) |
110.45 |
109.30 - 119.22 |
1.2167 times |
DMA SMA EMA moving averages of Hartford Financial HIG
DMA (daily moving average) of Hartford Financial HIG
| DMA period | DMA value | | 5 day DMA | 134.51 | | 12 day DMA | 135.05 | | 20 day DMA | 133.61 | | 35 day DMA | 129.8 | | 50 day DMA | 130.44 | | 100 day DMA | 129.47 | | 150 day DMA | 128.52 | | 200 day DMA | 125.68 | EMA (exponential moving average) of Hartford Financial HIG
| EMA period | EMA current | EMA prev | EMA prev2 | | 5 day EMA | 133.9 | 134.92 | 135.86 | | 12 day EMA | 134.15 | 134.57 | 134.85 | | 20 day EMA | 133.26 | 133.41 | 133.45 | | 35 day EMA | 132.36 | 132.39 | 132.35 | | 50 day EMA | 130.85 | 130.81 | 130.72 |
SMA (simple moving average) of Hartford Financial HIG
| SMA period | SMA current | SMA prev | SMA prev2 | | 5 day SMA | 134.51 | 135.61 | 136.52 | | 12 day SMA | 135.05 | 135.07 | 135.14 | | 20 day SMA | 133.61 | 133.43 | 133.18 | | 35 day SMA | 129.8 | 129.71 | 129.65 | | 50 day SMA | 130.44 | 130.42 | 130.39 | | 100 day SMA | 129.47 | 129.37 | 129.26 | | 150 day SMA | 128.52 | 128.43 | 128.34 | | 200 day SMA | 125.68 | 125.57 | 125.47 |
|
|
