HillenbrandInc HI full analysis,charts,indicators,moving averages,SMA,DMA,EMA,ADX,MACD,RSIHillenbrand Inc HI WideScreen charts, DMA,SMA,EMA technical analysis, forecast prediction, by indicators ADX,MACD,RSI,CCI USA stock exchange
operates under Consumer Durables sector & deals in Miscellaneous Manufacturing Industries
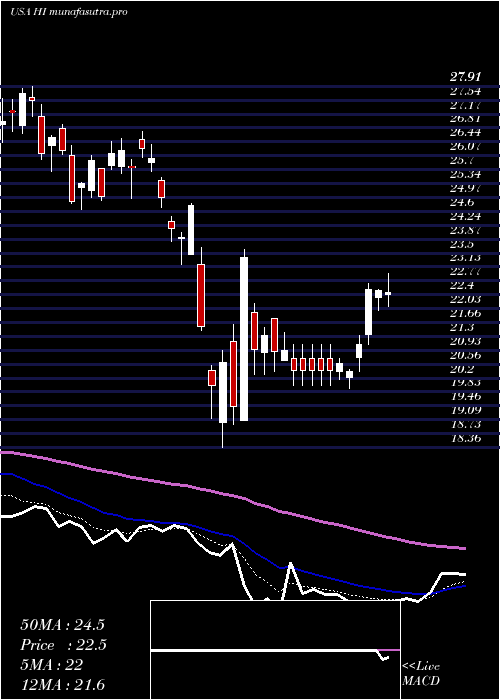
Daily price and charts and targets HillenbrandInc Strong Daily Stock price targets for HillenbrandInc HI are 31.4 and 31.53 | Daily Target 1 | 31.38 | | Daily Target 2 | 31.42 | | Daily Target 3 | 31.506666666667 | | Daily Target 4 | 31.55 | | Daily Target 5 | 31.64 |
Daily price and volume Hillenbrand Inc
| Date |
Closing |
Open |
Range |
Volume |
Mon 20 October 2025 |
31.47 (-0.06%) |
31.53 |
31.46 - 31.59 |
0.3934 times |
Fri 17 October 2025 |
31.49 (0.57%) |
31.46 |
31.42 - 31.54 |
0.9559 times |
Thu 16 October 2025 |
31.31 (0%) |
31.26 |
31.24 - 31.40 |
1.5174 times |
Wed 15 October 2025 |
31.31 (18.2%) |
31.41 |
31.16 - 31.44 |
6.3641 times |
Tue 14 October 2025 |
26.49 (1.07%) |
25.49 |
25.49 - 26.53 |
0.0992 times |
Mon 13 October 2025 |
26.21 (6.67%) |
25.25 |
25.02 - 26.37 |
0.1988 times |
Fri 10 October 2025 |
24.57 (-4.58%) |
25.84 |
24.55 - 26.04 |
0.1752 times |
Thu 09 October 2025 |
25.75 (-1.72%) |
26.22 |
25.73 - 26.36 |
0.094 times |
Wed 08 October 2025 |
26.20 (0.77%) |
26.17 |
25.68 - 26.60 |
0.1144 times |
Tue 07 October 2025 |
26.00 (-2.59%) |
26.87 |
25.84 - 26.91 |
0.0877 times |
Mon 06 October 2025 |
26.69 (-0.52%) |
27.23 |
26.57 - 27.24 |
0.0866 times |
Weekly price and charts HillenbrandInc Strong weekly Stock price targets for HillenbrandInc HI are 31.4 and 31.53 | Weekly Target 1 | 31.38 | | Weekly Target 2 | 31.42 | | Weekly Target 3 | 31.506666666667 | | Weekly Target 4 | 31.55 | | Weekly Target 5 | 31.64 |
Weekly price and volumes for Hillenbrand Inc
| Date |
Closing |
Open |
Range |
Volume |
Mon 20 October 2025 |
31.47 (-0.06%) |
31.53 |
31.46 - 31.59 |
0.2969 times |
Fri 17 October 2025 |
31.49 (28.16%) |
25.25 |
25.02 - 31.54 |
6.8953 times |
Fri 10 October 2025 |
24.57 (-8.42%) |
27.23 |
24.55 - 27.24 |
0.421 times |
Fri 03 October 2025 |
26.83 (3.19%) |
26.18 |
25.64 - 27.59 |
0.4114 times |
Fri 26 September 2025 |
26.00 (5.61%) |
24.59 |
22.98 - 26.44 |
0.5976 times |
Fri 19 September 2025 |
24.62 (0.2%) |
24.46 |
24.03 - 25.62 |
0.408 times |
Fri 12 September 2025 |
24.57 (-6.33%) |
26.25 |
24.50 - 26.25 |
0.3067 times |
Fri 05 September 2025 |
26.23 (3.31%) |
24.77 |
24.34 - 26.88 |
0.2483 times |
Fri 29 August 2025 |
25.39 (0%) |
25.97 |
25.15 - 26.13 |
0.0522 times |
Fri 29 August 2025 |
25.39 (-2.65%) |
25.93 |
24.58 - 26.13 |
0.3625 times |
Fri 22 August 2025 |
26.08 (3.62%) |
25.20 |
24.12 - 26.63 |
0.4815 times |
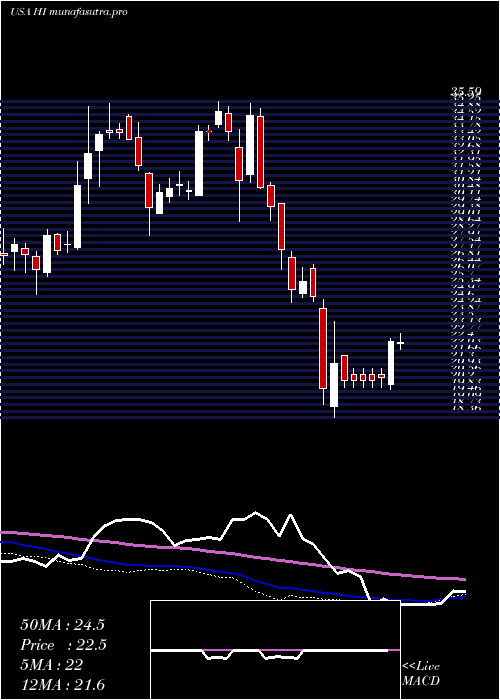
Monthly price and charts HillenbrandInc Strong monthly Stock price targets for HillenbrandInc HI are 28.01 and 35.05 | Monthly Target 1 | 22.16 | | Monthly Target 2 | 26.82 | | Monthly Target 3 | 29.203333333333 | | Monthly Target 4 | 33.86 | | Monthly Target 5 | 36.24 |
Monthly price and volumes Hillenbrand Inc
| Date |
Closing |
Open |
Range |
Volume |
Mon 20 October 2025 |
31.47 (16.38%) |
26.85 |
24.55 - 31.59 |
3.4604 times |
Tue 30 September 2025 |
27.04 (6.5%) |
24.77 |
22.98 - 27.30 |
0.7842 times |
Fri 29 August 2025 |
25.39 (22.6%) |
20.10 |
19.28 - 27.08 |
1.009 times |
Thu 31 July 2025 |
20.71 (3.19%) |
19.89 |
19.89 - 23.60 |
0.6695 times |
Mon 30 June 2025 |
20.07 (2.71%) |
19.49 |
18.46 - 22.26 |
0.6038 times |
Fri 30 May 2025 |
19.54 (-3.41%) |
20.32 |
18.62 - 23.37 |
0.9016 times |
Wed 30 April 2025 |
20.23 (-16.2%) |
23.88 |
18.36 - 24.81 |
0.7649 times |
Mon 31 March 2025 |
24.14 (-19.26%) |
30.03 |
23.81 - 30.05 |
0.5768 times |
Fri 28 February 2025 |
29.90 (-12.03%) |
33.08 |
29.05 - 35.48 |
0.7021 times |
Fri 31 January 2025 |
33.99 (10.43%) |
31.16 |
30.12 - 35.59 |
0.5277 times |
Tue 31 December 2024 |
30.78 (-9.23%) |
34.78 |
28.28 - 34.89 |
0.4989 times |

DMA SMA EMA moving averages of Hillenbrand Inc HI
DMA (daily moving average) of Hillenbrand Inc HI
| DMA period | DMA value | | 5 day DMA | 30.41 | | 12 day DMA | 27.86 | | 20 day DMA | 26.97 | | 35 day DMA | 26.15 | | 50 day DMA | 25.88 | | 100 day DMA | 23.38 | | 150 day DMA | 22.86 | | 200 day DMA | 25.01 | EMA (exponential moving average) of Hillenbrand Inc HI
| EMA period | EMA current | EMA prev | EMA prev2 | | 5 day EMA | 30.36 | 29.81 | 28.97 | | 12 day EMA | 28.61 | 28.09 | 27.47 | | 20 day EMA | 27.61 | 27.2 | 26.75 | | 35 day EMA | 26.58 | 26.29 | 25.98 | | 50 day EMA | 25.86 | 25.63 | 25.39 |
SMA (simple moving average) of Hillenbrand Inc HI
| SMA period | SMA current | SMA prev | SMA prev2 | | 5 day SMA | 30.41 | 29.36 | 27.98 | | 12 day SMA | 27.86 | 27.49 | 27.09 | | 20 day SMA | 26.97 | 26.66 | 26.31 | | 35 day SMA | 26.15 | 25.97 | 25.8 | | 50 day SMA | 25.88 | 25.65 | 25.41 | | 100 day SMA | 23.38 | 23.26 | 23.14 | | 150 day SMA | 22.86 | 22.83 | 22.79 | | 200 day SMA | 25.01 | 25.01 | 25 |
|
|
