HeritageFinancial HFWA full analysis,charts,indicators,moving averages,SMA,DMA,EMA,ADX,MACD,RSIHeritage Financial HFWA WideScreen charts, DMA,SMA,EMA technical analysis, forecast prediction, by indicators ADX,MACD,RSI,CCI USA stock exchange
operates under Finance sector & deals in Banks
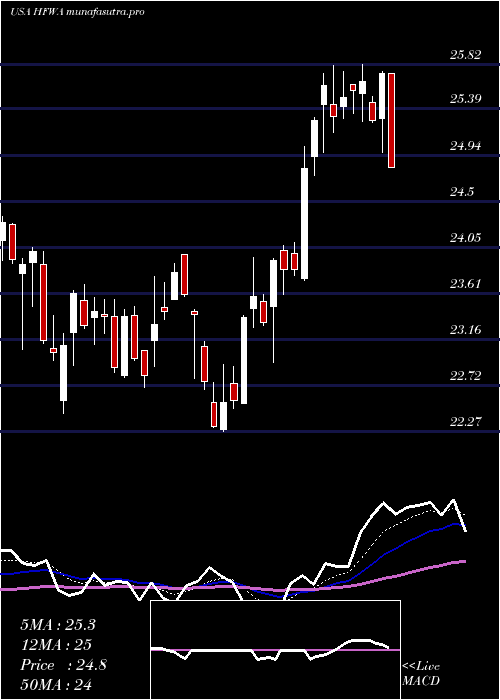
Daily price and charts and targets HeritageFinancial Strong Daily Stock price targets for HeritageFinancial HFWA are 24.07 and 24.44 | Daily Target 1 | 23.78 | | Daily Target 2 | 23.99 | | Daily Target 3 | 24.146666666667 | | Daily Target 4 | 24.36 | | Daily Target 5 | 24.52 |
Daily price and volume Heritage Financial
| Date |
Closing |
Open |
Range |
Volume |
Thu 04 December 2025 |
24.21 (0.54%) |
24.01 |
23.93 - 24.30 |
0.5503 times |
Wed 03 December 2025 |
24.08 (0.58%) |
23.95 |
23.80 - 24.37 |
0.7143 times |
Tue 02 December 2025 |
23.94 (-0.46%) |
24.05 |
23.85 - 24.17 |
0.7233 times |
Mon 01 December 2025 |
24.05 (0.46%) |
23.73 |
23.55 - 24.26 |
0.8391 times |
Fri 28 November 2025 |
23.94 (-1.28%) |
24.16 |
23.85 - 24.36 |
0.7629 times |
Wed 26 November 2025 |
24.25 (-0.9%) |
24.27 |
24.20 - 24.62 |
2.0017 times |
Tue 25 November 2025 |
24.47 (5.02%) |
23.57 |
23.53 - 24.65 |
1.4009 times |
Mon 24 November 2025 |
23.30 (0.13%) |
23.20 |
23.07 - 23.42 |
0.9625 times |
Fri 21 November 2025 |
23.27 (4.26%) |
22.44 |
22.44 - 23.45 |
1.0106 times |
Thu 20 November 2025 |
22.32 (0.5%) |
22.41 |
21.94 - 22.76 |
1.0344 times |
Wed 19 November 2025 |
22.21 (0.77%) |
22.00 |
22.00 - 22.34 |
0.9468 times |
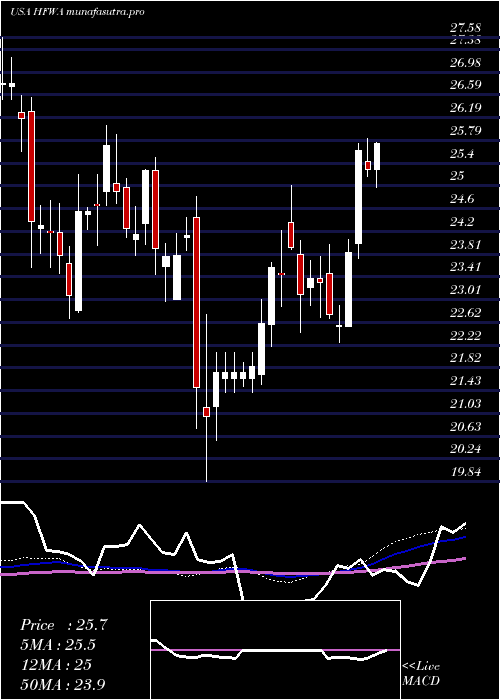
Weekly price and charts HeritageFinancial Strong weekly Stock price targets for HeritageFinancial HFWA are 23.88 and 24.7 | Weekly Target 1 | 23.22 | | Weekly Target 2 | 23.72 | | Weekly Target 3 | 24.043333333333 | | Weekly Target 4 | 24.54 | | Weekly Target 5 | 24.86 |
Weekly price and volumes for Heritage Financial
| Date |
Closing |
Open |
Range |
Volume |
Thu 04 December 2025 |
24.21 (1.13%) |
23.73 |
23.55 - 24.37 |
0.763 times |
Fri 28 November 2025 |
23.94 (2.88%) |
23.20 |
23.07 - 24.65 |
1.384 times |
Fri 21 November 2025 |
23.27 (4.73%) |
22.15 |
21.32 - 23.45 |
1.4141 times |
Fri 14 November 2025 |
22.22 (0.73%) |
22.13 |
21.79 - 22.72 |
0.9177 times |
Fri 07 November 2025 |
22.06 (-0.59%) |
22.43 |
21.89 - 22.61 |
1.2432 times |
Fri 31 October 2025 |
22.19 (0%) |
22.27 |
21.97 - 22.40 |
0.2041 times |
Fri 31 October 2025 |
22.19 (-4.02%) |
23.13 |
21.97 - 23.53 |
1.077 times |
Fri 24 October 2025 |
23.12 (5.14%) |
22.19 |
21.95 - 23.50 |
1.2039 times |
Fri 17 October 2025 |
21.99 (-3.43%) |
23.02 |
21.97 - 24.08 |
0.991 times |
Fri 10 October 2025 |
22.77 (-6.45%) |
24.57 |
22.74 - 24.82 |
0.8021 times |
Fri 03 October 2025 |
24.34 (-2.05%) |
25.00 |
23.68 - 25.00 |
0.9526 times |
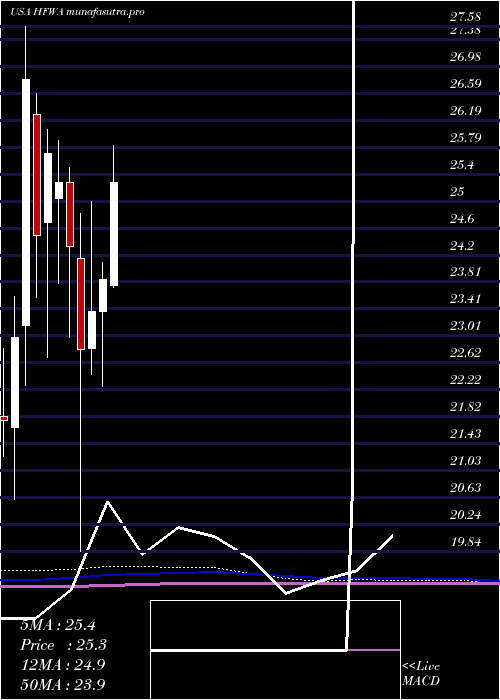
Monthly price and charts HeritageFinancial Strong monthly Stock price targets for HeritageFinancial HFWA are 23.88 and 24.7 | Monthly Target 1 | 23.22 | | Monthly Target 2 | 23.72 | | Monthly Target 3 | 24.043333333333 | | Monthly Target 4 | 24.54 | | Monthly Target 5 | 24.86 |
Monthly price and volumes Heritage Financial
| Date |
Closing |
Open |
Range |
Volume |
Thu 04 December 2025 |
24.21 (1.13%) |
23.73 |
23.55 - 24.37 |
0.1523 times |
Fri 28 November 2025 |
23.94 (7.89%) |
22.43 |
21.32 - 24.65 |
0.9898 times |
Fri 31 October 2025 |
22.19 (-8.27%) |
23.96 |
21.95 - 24.82 |
0.9576 times |
Tue 30 September 2025 |
24.19 (-1.02%) |
24.16 |
23.53 - 25.43 |
1.0581 times |
Fri 29 August 2025 |
24.44 (8.43%) |
22.21 |
21.86 - 24.90 |
0.8036 times |
Thu 31 July 2025 |
22.54 (-5.45%) |
23.75 |
22.31 - 25.82 |
0.8692 times |
Mon 30 June 2025 |
23.84 (1.97%) |
23.38 |
22.27 - 24.10 |
0.8338 times |
Fri 30 May 2025 |
23.38 (2.45%) |
22.83 |
22.45 - 25.00 |
1.0324 times |
Wed 30 April 2025 |
22.82 (-6.21%) |
24.16 |
19.84 - 24.82 |
1.2915 times |
Mon 31 March 2025 |
24.33 (-3.72%) |
25.27 |
22.99 - 25.49 |
2.0118 times |
Fri 28 February 2025 |
25.27 (-1.67%) |
25.04 |
23.79 - 25.89 |
1.0071 times |
DMA SMA EMA moving averages of Heritage Financial HFWA
DMA (daily moving average) of Heritage Financial HFWA
| DMA period | DMA value | | 5 day DMA | 24.04 | | 12 day DMA | 23.51 | | 20 day DMA | 22.97 | | 35 day DMA | 22.82 | | 50 day DMA | 23.17 | | 100 day DMA | 23.6 | | 150 day DMA | 23.66 | | 200 day DMA | 23.54 | EMA (exponential moving average) of Heritage Financial HFWA
| EMA period | EMA current | EMA prev | EMA prev2 | | 5 day EMA | 24.04 | 23.95 | 23.88 | | 12 day EMA | 23.63 | 23.52 | 23.42 | | 20 day EMA | 23.36 | 23.27 | 23.18 | | 35 day EMA | 23.32 | 23.27 | 23.22 | | 50 day EMA | 23.39 | 23.36 | 23.33 |
SMA (simple moving average) of Heritage Financial HFWA
| SMA period | SMA current | SMA prev | SMA prev2 | | 5 day SMA | 24.04 | 24.05 | 24.13 | | 12 day SMA | 23.51 | 23.28 | 23.12 | | 20 day SMA | 22.97 | 22.88 | 22.8 | | 35 day SMA | 22.82 | 22.8 | 22.79 | | 50 day SMA | 23.17 | 23.18 | 23.19 | | 100 day SMA | 23.6 | 23.6 | 23.62 | | 150 day SMA | 23.66 | 23.66 | 23.65 | | 200 day SMA | 23.54 | 23.54 | 23.54 |
|
|
