JohnHancock HEQ full analysis,charts,indicators,moving averages,SMA,DMA,EMA,ADX,MACD,RSIJohn Hancock HEQ WideScreen charts, DMA,SMA,EMA technical analysis, forecast prediction, by indicators ADX,MACD,RSI,CCI USA stock exchange
operates under N A sector & deals in N A
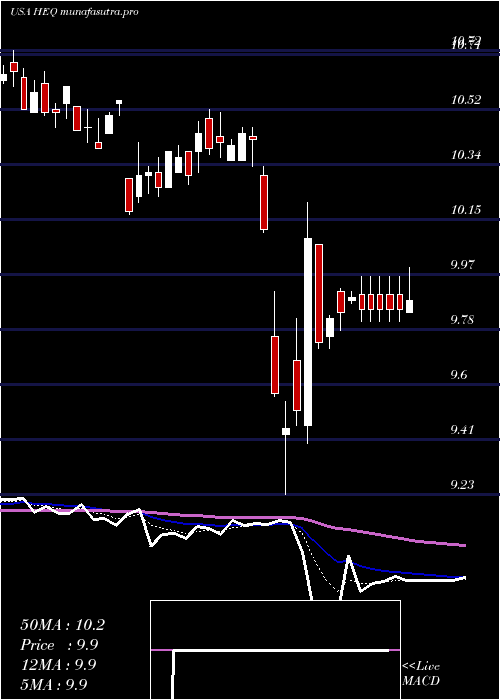
Daily price and charts and targets JohnHancock Strong Daily Stock price targets for JohnHancock HEQ are 10.57 and 10.65 | Daily Target 1 | 10.55 | | Daily Target 2 | 10.58 | | Daily Target 3 | 10.626666666667 | | Daily Target 4 | 10.66 | | Daily Target 5 | 10.71 |
Daily price and volume John Hancock
| Date |
Closing |
Open |
Range |
Volume |
Fri 17 October 2025 |
10.62 (-0.38%) |
10.66 |
10.59 - 10.67 |
0.3428 times |
Thu 16 October 2025 |
10.66 (-0.28%) |
10.69 |
10.66 - 10.75 |
1.6217 times |
Wed 15 October 2025 |
10.69 (0.75%) |
10.67 |
10.63 - 10.73 |
1.1062 times |
Tue 14 October 2025 |
10.61 (0.28%) |
10.59 |
10.46 - 10.65 |
1.184 times |
Mon 13 October 2025 |
10.58 (1.15%) |
10.49 |
10.49 - 10.62 |
0.727 times |
Fri 10 October 2025 |
10.46 (-1.41%) |
10.60 |
10.46 - 10.64 |
1.488 times |
Thu 09 October 2025 |
10.61 (-0.28%) |
10.67 |
10.57 - 10.75 |
0.7999 times |
Wed 08 October 2025 |
10.64 (0.57%) |
10.60 |
10.60 - 10.65 |
0.6856 times |
Tue 07 October 2025 |
10.58 (0%) |
10.58 |
10.58 - 10.69 |
0.9312 times |
Mon 06 October 2025 |
10.58 (-0.94%) |
10.66 |
10.58 - 10.74 |
1.1136 times |
Fri 03 October 2025 |
10.68 (0.56%) |
10.68 |
10.62 - 10.69 |
0.4571 times |
Weekly price and charts JohnHancock Strong weekly Stock price targets for JohnHancock HEQ are 10.54 and 10.83 | Weekly Target 1 | 10.32 | | Weekly Target 2 | 10.47 | | Weekly Target 3 | 10.61 | | Weekly Target 4 | 10.76 | | Weekly Target 5 | 10.9 |
Weekly price and volumes for John Hancock
| Date |
Closing |
Open |
Range |
Volume |
Fri 17 October 2025 |
10.62 (1.53%) |
10.49 |
10.46 - 10.75 |
1.4404 times |
Fri 10 October 2025 |
10.46 (-2.06%) |
10.66 |
10.46 - 10.75 |
1.4509 times |
Fri 03 October 2025 |
10.68 (1.33%) |
10.58 |
10.51 - 10.75 |
1.1188 times |
Fri 26 September 2025 |
10.54 (-0.19%) |
10.52 |
10.52 - 10.70 |
0.9553 times |
Fri 19 September 2025 |
10.56 (-0.66%) |
10.66 |
10.51 - 10.74 |
1.2731 times |
Fri 12 September 2025 |
10.63 (-1.39%) |
10.81 |
10.57 - 10.87 |
1.2407 times |
Fri 05 September 2025 |
10.78 (0%) |
10.73 |
10.72 - 10.83 |
0.769 times |
Fri 29 August 2025 |
10.78 (0%) |
10.78 |
10.70 - 10.80 |
0.0879 times |
Fri 29 August 2025 |
10.78 (0%) |
10.78 |
10.70 - 10.83 |
0.7416 times |
Fri 22 August 2025 |
10.78 (0.94%) |
10.68 |
10.59 - 10.80 |
0.9223 times |
Fri 15 August 2025 |
10.68 (0.75%) |
10.53 |
10.53 - 10.70 |
0.7311 times |
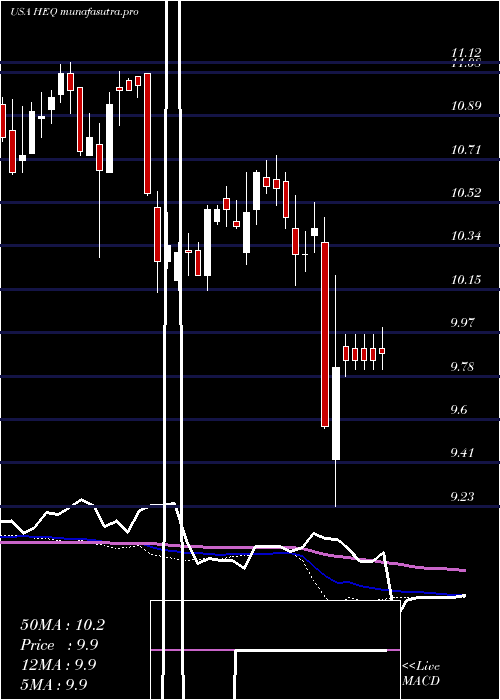
Monthly price and charts JohnHancock Strong monthly Stock price targets for JohnHancock HEQ are 10.4 and 10.69 | Monthly Target 1 | 10.32 | | Monthly Target 2 | 10.47 | | Monthly Target 3 | 10.61 | | Monthly Target 4 | 10.76 | | Monthly Target 5 | 10.9 |
Monthly price and volumes John Hancock
| Date |
Closing |
Open |
Range |
Volume |
Fri 17 October 2025 |
10.62 (-0.28%) |
10.64 |
10.46 - 10.75 |
0.8886 times |
Tue 30 September 2025 |
10.65 (-1.21%) |
10.73 |
10.51 - 10.87 |
1.2535 times |
Fri 29 August 2025 |
10.78 (2.96%) |
10.44 |
10.36 - 10.83 |
0.8708 times |
Thu 31 July 2025 |
10.47 (-1.04%) |
10.56 |
10.46 - 10.73 |
0.9729 times |
Mon 30 June 2025 |
10.58 (0.28%) |
10.54 |
10.37 - 10.73 |
0.8213 times |
Fri 30 May 2025 |
10.55 (4.15%) |
10.16 |
10.16 - 10.65 |
0.7609 times |
Wed 30 April 2025 |
10.13 (-2.6%) |
10.35 |
9.23 - 10.46 |
1.5563 times |
Mon 31 March 2025 |
10.40 (-1.7%) |
10.61 |
10.17 - 10.65 |
0.7294 times |
Fri 28 February 2025 |
10.58 (1.54%) |
10.31 |
10.26 - 10.72 |
0.925 times |
Fri 31 January 2025 |
10.42 (2.06%) |
10.22 |
10.15 - 10.59 |
1.2213 times |
Tue 31 December 2024 |
10.21 (-7.18%) |
11.06 |
10.14 - 11.07 |
1.6563 times |

DMA SMA EMA moving averages of John Hancock HEQ
DMA (daily moving average) of John Hancock HEQ
| DMA period | DMA value | | 5 day DMA | 10.63 | | 12 day DMA | 10.61 | | 20 day DMA | 10.6 | | 35 day DMA | 10.65 | | 50 day DMA | 10.66 | | 100 day DMA | 10.61 | | 150 day DMA | 10.47 | | 200 day DMA | 10.47 | EMA (exponential moving average) of John Hancock HEQ
| EMA period | EMA current | EMA prev | EMA prev2 | | 5 day EMA | 10.63 | 10.63 | 10.62 | | 12 day EMA | 10.62 | 10.62 | 10.61 | | 20 day EMA | 10.62 | 10.62 | 10.62 | | 35 day EMA | 10.62 | 10.62 | 10.62 | | 50 day EMA | 10.65 | 10.65 | 10.65 |
SMA (simple moving average) of John Hancock HEQ
| SMA period | SMA current | SMA prev | SMA prev2 | | 5 day SMA | 10.63 | 10.6 | 10.59 | | 12 day SMA | 10.61 | 10.62 | 10.61 | | 20 day SMA | 10.6 | 10.6 | 10.59 | | 35 day SMA | 10.65 | 10.66 | 10.66 | | 50 day SMA | 10.66 | 10.66 | 10.66 | | 100 day SMA | 10.61 | 10.61 | 10.61 | | 150 day SMA | 10.47 | 10.47 | 10.46 | | 200 day SMA | 10.47 | 10.47 | 10.47 |
|
|
