HawaiianElectric HE full analysis,charts,indicators,moving averages,SMA,DMA,EMA,ADX,MACD,RSIHawaiian Electric HE WideScreen charts, DMA,SMA,EMA technical analysis, forecast prediction, by indicators ADX,MACD,RSI,CCI USA stock exchange
operates under Public Utilities sector & deals in Electric Utilities Central
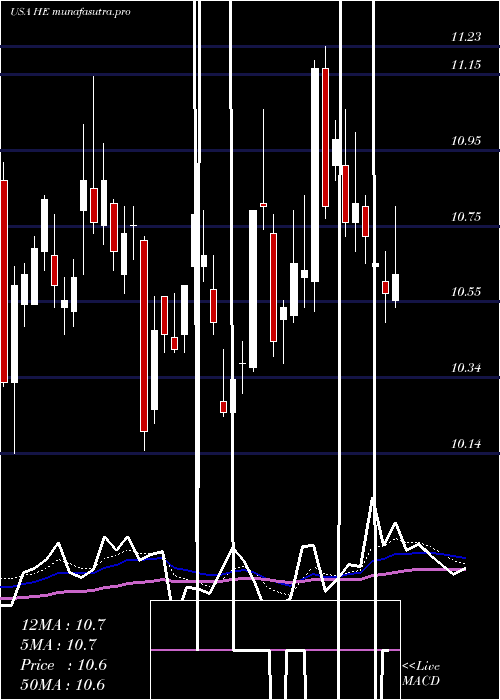
Daily price and charts and targets HawaiianElectric Strong Daily Stock price targets for HawaiianElectric HE are 11.21 and 11.39 | Daily Target 1 | 11.07 | | Daily Target 2 | 11.17 | | Daily Target 3 | 11.246666666667 | | Daily Target 4 | 11.35 | | Daily Target 5 | 11.43 |
Daily price and volume Hawaiian Electric
| Date |
Closing |
Open |
Range |
Volume |
Fri 17 October 2025 |
11.28 (0.09%) |
11.19 |
11.14 - 11.32 |
0.8583 times |
Thu 16 October 2025 |
11.27 (-0.27%) |
11.34 |
11.19 - 11.44 |
0.9756 times |
Wed 15 October 2025 |
11.30 (0.53%) |
11.23 |
11.20 - 11.46 |
0.866 times |
Tue 14 October 2025 |
11.24 (2.09%) |
11.00 |
10.95 - 11.26 |
1.0441 times |
Mon 13 October 2025 |
11.01 (-2.74%) |
10.92 |
10.90 - 11.08 |
0.8484 times |
Tue 07 October 2025 |
11.32 (0.62%) |
11.30 |
11.23 - 11.46 |
1.2349 times |
Mon 06 October 2025 |
11.25 (0.81%) |
11.30 |
11.14 - 11.44 |
0.8312 times |
Fri 03 October 2025 |
11.16 (0.45%) |
11.19 |
11.13 - 11.27 |
0.7128 times |
Thu 02 October 2025 |
11.11 (0.82%) |
11.03 |
10.92 - 11.13 |
1.0253 times |
Wed 01 October 2025 |
11.02 (-0.18%) |
11.07 |
11.00 - 11.26 |
1.6034 times |
Tue 30 September 2025 |
11.04 (-0.09%) |
11.06 |
10.98 - 11.14 |
1.5902 times |
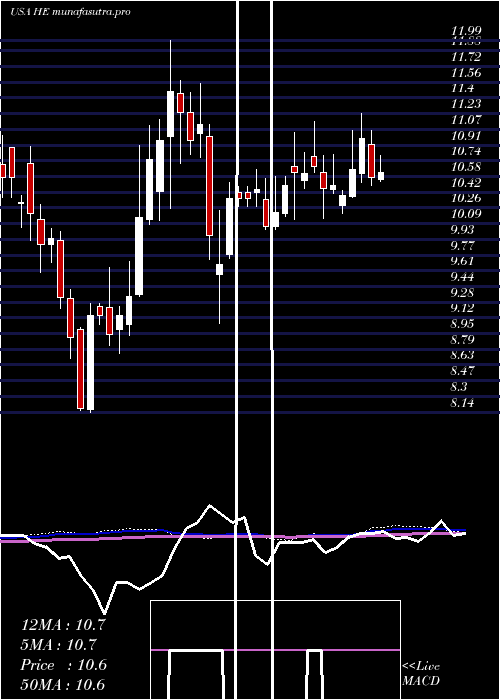
Weekly price and charts HawaiianElectric Strong weekly Stock price targets for HawaiianElectric HE are 11.09 and 11.65 | Weekly Target 1 | 10.65 | | Weekly Target 2 | 10.97 | | Weekly Target 3 | 11.213333333333 | | Weekly Target 4 | 11.53 | | Weekly Target 5 | 11.77 |
Weekly price and volumes for Hawaiian Electric
| Date |
Closing |
Open |
Range |
Volume |
Fri 17 October 2025 |
11.28 (-0.35%) |
10.92 |
10.90 - 11.46 |
0.8243 times |
Tue 07 October 2025 |
11.32 (1.43%) |
11.30 |
11.14 - 11.46 |
0.3708 times |
Fri 03 October 2025 |
11.16 (0%) |
11.17 |
10.92 - 11.27 |
1.076 times |
Fri 26 September 2025 |
11.16 (-5.5%) |
11.82 |
11.09 - 11.82 |
0.9669 times |
Fri 19 September 2025 |
11.81 (-2.4%) |
12.17 |
11.78 - 12.30 |
1.1018 times |
Fri 12 September 2025 |
12.10 (-1.71%) |
12.30 |
11.74 - 12.34 |
1.0486 times |
Fri 05 September 2025 |
12.31 (-5.02%) |
12.82 |
12.07 - 12.84 |
1.1557 times |
Fri 29 August 2025 |
12.96 (0%) |
12.94 |
12.87 - 13.41 |
0.581 times |
Fri 29 August 2025 |
12.96 (6.23%) |
12.15 |
12.12 - 13.41 |
1.7309 times |
Fri 22 August 2025 |
12.20 (7.02%) |
11.43 |
11.33 - 12.23 |
1.1441 times |
Fri 15 August 2025 |
11.40 (5.65%) |
10.87 |
10.77 - 11.56 |
1.2946 times |
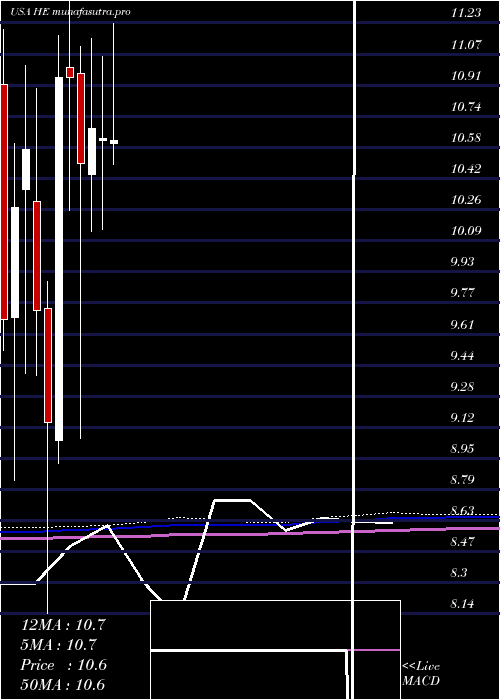
Monthly price and charts HawaiianElectric Strong monthly Stock price targets for HawaiianElectric HE are 11.09 and 11.65 | Monthly Target 1 | 10.65 | | Monthly Target 2 | 10.97 | | Monthly Target 3 | 11.213333333333 | | Monthly Target 4 | 11.53 | | Monthly Target 5 | 11.77 |
Monthly price and volumes Hawaiian Electric
| Date |
Closing |
Open |
Range |
Volume |
Fri 17 October 2025 |
11.28 (2.17%) |
11.07 |
10.90 - 11.46 |
0.3361 times |
Tue 30 September 2025 |
11.04 (-14.81%) |
12.82 |
10.98 - 12.84 |
0.8892 times |
Fri 29 August 2025 |
12.96 (20.9%) |
10.74 |
10.60 - 13.41 |
1.1185 times |
Thu 31 July 2025 |
10.72 (0.85%) |
10.60 |
10.45 - 11.23 |
0.8536 times |
Mon 30 June 2025 |
10.63 (-0.47%) |
10.62 |
10.15 - 11.06 |
0.7452 times |
Fri 30 May 2025 |
10.68 (1.71%) |
10.44 |
10.14 - 11.15 |
0.8755 times |
Wed 30 April 2025 |
10.50 (-4.11%) |
10.97 |
9.06 - 11.11 |
0.9466 times |
Mon 31 March 2025 |
10.95 (0%) |
11.00 |
10.25 - 11.99 |
1.1915 times |
Fri 28 February 2025 |
10.95 (19.8%) |
9.05 |
8.93 - 11.17 |
1.5732 times |
Fri 31 January 2025 |
9.14 (-6.06%) |
9.74 |
8.14 - 9.88 |
1.4707 times |
Tue 31 December 2024 |
9.73 (-7.95%) |
10.30 |
9.39 - 10.89 |
1.202 times |
DMA SMA EMA moving averages of Hawaiian Electric HE
DMA (daily moving average) of Hawaiian Electric HE
| DMA period | DMA value | | 5 day DMA | 11.22 | | 12 day DMA | 11.17 | | 20 day DMA | 11.34 | | 35 day DMA | 11.77 | | 50 day DMA | 11.69 | | 100 day DMA | 11.18 | | 150 day DMA | 10.96 | | 200 day DMA | 10.66 | EMA (exponential moving average) of Hawaiian Electric HE
| EMA period | EMA current | EMA prev | EMA prev2 | | 5 day EMA | 11.25 | 11.24 | 11.22 | | 12 day EMA | 11.27 | 11.27 | 11.27 | | 20 day EMA | 11.37 | 11.38 | 11.39 | | 35 day EMA | 11.43 | 11.44 | 11.45 | | 50 day EMA | 11.58 | 11.59 | 11.6 |
SMA (simple moving average) of Hawaiian Electric HE
| SMA period | SMA current | SMA prev | SMA prev2 | | 5 day SMA | 11.22 | 11.23 | 11.22 | | 12 day SMA | 11.17 | 11.16 | 11.15 | | 20 day SMA | 11.34 | 11.38 | 11.43 | | 35 day SMA | 11.77 | 11.79 | 11.82 | | 50 day SMA | 11.69 | 11.69 | 11.67 | | 100 day SMA | 11.18 | 11.18 | 11.17 | | 150 day SMA | 10.96 | 10.96 | 10.96 | | 200 day SMA | 10.66 | 10.65 | 10.65 |
|
|
